Southern California Coastal Ocean Observing System (website)
![]() SCCOOS brings together coastal observations in the Southern California Bight to provide information necessary to address issues in climate change, ecosystem preservation and management, coastal water quality, maritime operations, coastal hazards and national security.
SCCOOS brings together coastal observations in the Southern California Bight to provide information necessary to address issues in climate change, ecosystem preservation and management, coastal water quality, maritime operations, coastal hazards and national security.
In 2004, CalCOFI added 9 SCCOOS stations to the standard 66 station pattern. Stations are typically positioned on the 20m isobath. On each station, a CTD Rosette is deployed measuring temperature, salinity, oxygen, fluorescence, transmittance, nitrate and PAR. CTD-rosette 10L bottles are closed at 5m depth intervals (~4: 1, 5, 10, 15) isolating seawater for analysis of salinity, dissolved oxygen, chlorophyll-a, and nutrients. Data for these measurements can be found in individual hydrographic data reports starting in 2004. HPLC, POM, TOC and Size Fractionation are also measured at these stations by our CCE-LTER affiliate. These data are located on the Ocean Informatics DataZoo website. A Bongo net is also towed at every SCCOOS station and zooplankton displacement volumes are reported in the data reports.
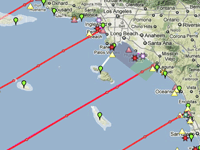
- SCCOOS Stations on Google maps (www.sccoos.org/kml/calcofi_sccoos.kml)
|
Line |
Sta |
Lat deg |
Lat mins |
Lon deg |
Lon mins |
Lon Dec |
Lat Dec |
 |
|
| 93.4 | 26.4 | 32 | 57.264 | 117 | 16.766 | 117.279 | 32.954 | ||
| 91.7 | 26.4 | 33 | 14.755 | 117 | 27.754 | 117.463 | 33.246 | ||
| 90.0 | 27.7 | 33 | 29.678 | 117 | 44.831 | 117.747 | 33.495 | ||
| 88.5 | 30.1 | 33 | 40.37 | 118 | 5.658 | 118.094 | 33.673 | ||
| 86.8 | 32.5 | 33 | 53.4 | 118 | 26.5 | 118.442 | 33.89 | ||
| 85.4 | 35.8 | 34 | 0.8 | 118 | 49.9 | 118.832 | 34.013 | ||
| 83.3 | 39.4 | 34 | 15.534 | 119 | 19.446 | 119.324 | 34.259 | ||
| 81.7 | 43.5 | 34 | 24.5 | 119 | 48.09 | 119.801 | 34.408 | ||
| 80.0 | 50.5 | 34 | 27.724 | 120 | 29.061 | 120.484 | 34.462 |
 |
SCCOOS brings together coastal observations in the Southern California Bight to provide information necessary to address issues in climate change, ecosystem preservation and management, coastal water quality, maritime operations, coastal hazards and national security. As a science-based decision support system, SCCOOS works interactively with local, state and federal agencies, resource managers, industry, policy makers, educators, scientists and the general public to provide data, models and products that advance our understanding of the current and future state of our coastal and global environment.
The objective of SCCOOS Nearshore Observations is to extend CalCOFI time series to the nearshore. Nearshore observations consist of 9 stations at the ends and interspersed with current CalCOFI lines on the 20 m isobath with a standard set of CalCOFI observations.
 |
Additional Information |
|
||||||||||||||||||||||||||||||||||||||||||||||||||||||||||||||||||||||||||||||||||||||||||||||||||||||||||||||||||||||||||||||||||||||||||||||||||||||||||||||||||||||||||||||||||||||||||||||||||||||||||||||||||||||||||||||||||||||||||||||||||||||||||||||||||||||||||||||||||||||||||||||||||||||||||||||||||||||||||||||||||||||||||||||||||||||||||||||||||||||||||||||||||||||||||||||||||||||||||||||||||||||||||||||||||||||||||||||||||||||||||||||||||||||||||||||||||||||||||||||||||||||||||||||||||||||||||||||||||||||||||||||||||||||||||||||||||||||||||||||||||||||||||||||||||||||||||||||||||||||||||||||||||||||||||||||||||||||||||||||||||||||||||||||||||||||||||||||||||||||||||||
SCCOOS Hydrographic Reports are part of the CalCOFI Data Reports. To display this tabulated, hydrographic station data, select the 'X' from the SCCOOS station occupation table.