SeasaveV7 on Windows 7 CTD Operator's Cookbook
- Turn on deck unit and be sure what is displayed on the front LED panel are non-zeros.
- In Seasave v7, select RealTimeData/Start from the menu.
- Do Not store data on disk immediately so select “Begin archiving data when the start archiving command is sent”.
- Click [Select Output Data Filename] and label the station’s data file (YYMM###.hex)
- Be sure the Instrument configuration file is YYMM_DoNotMove.con
- Click [Start] then fill out the header form which should include:
• Ship: (Full Name ie RV Bell M Shimada)
• Cruise: (YYMMSS ie 1704SH)
• Station: (LL.L SSS.S ie 93.3 120.0 using space only, not comma or / to separate the Line Sta)
• Cast: (### = order occupied ie 017)
• Operator: (Initials ie DMW)
• Cast Type: (PRODO, ROS, SCCOOS, ANCILLARY) - Record deck pressure from fixed display 2 (right middle screen).
- Deploy the CTD over the side, tell the winch to “zero at surface and take it to 10m”.
- Start the 2 minute timer.
- While waiting, find & record bottom depth; on NOAA vessels ask the survey tech or acoustician for a bottom depth. For Knudsen range adjustment: use the “cheat sheet” to adjust the proper depth ranges on the Knudsen. If this takes longer than 2 minutes and the depth is known to be deeper than 550m, come back to this task after starting the CTD downcast. As it is going down, keep adjusting the Knudsen until you get a definite bottom. If the weather is rough, this may be futile so note it on the console ops. Always use the CTD altimeter to determine the terminal depth on casts less than 515m.
- After 2 minutes on the timer, return CTD to surface. Click [OK] on the “data not saved” dialog box onscreen
- ***VERY IMPORTANT*** Start recording data to disk by pressing RealTimeData/Start Archiving. Also press Display/Erase All Plots to clear the screen plots of the 'noisy' surface-to-10m pre-soak sensor data.
- Verify the data is saving to disk by confirming the “archiving data to C:\YYMMSS\YYMM###.hex” just below the top toolbar menu.
- Send the CTD down to 515m (bottom depth permitting, otherwise to within 10m of bottom) at 30m/minute. After 100m, direct the winch operator to speed up to 50-55m/min, weather-permitting. If it is rough, continue down at 30m/min to terminal depth; if REALLY calm you can go 60m/min.
Use the altimeter to adjust the terminal depth if it is shallower than 515m or a basin station. The altimeter will usually start displaying the distance from bottom at ~50m off-bottom - this varies if the bottom is soft or wire angle is not near zero. The altimeter reading usually stabilizes within 30-20m off bottom so watch the altimeter value carefully and stop short if necessary to achieve the 10m off-bottom desired depth. If the weather is calm (very little ship roll), you can then adjust the terminal depth deeper a few meters if it results in a extra standard depth bottle (ie 10m or more from the next closest bottle). - Using the chl max visible on the downcast fluorometer profile, select the proper Console Operations (Console Ops) Cast-Type form: 0-50m Chl max = Type I; 50-120m chl max = Type II; or chl max >120m = Type III.
- When 515m is reached, be sure the CTD depth is 515m or deeper and it is not just 515m of wireout. If not, pay out more wire till the CTD depth reads 515m or more. Once the terminal depth is reached, record the wire-out, time-stopped, depth (to tenths); temperature, conductivity, and salinity (all to 3 decimals); altimeter if shallow. If the wire settles and the CTD is deeper than 515m, it is not necessary to readjust the CTD depth. After 20+seconds, click [Mark Scan] then [Fire Bottle] then, for the 1st trip only, [Add to .Nav File]. Record the Trip time and check the confirmation boxes (mrks & fired counts have incremented by +1). Before starting up, record the Time, Bottom Depth, Lat & Lon in the Rosette Start Up box on the Console Ops.
Record the CTDATDEPTH event using CELog, running in the background on the CTD computer if this event is not being logged by the bridge or wetlab. - If a Remote Depth Readout box is installed, tell the winch operator the next target depth from the Console Ops form. Otherwise, adjusting for wire vs pressure differences, tell the winch the next desired depth from the Console Ops adjusting for wire angle offset. Upcast winch speed can be 50-60m/min. Note: the Remote Depth Readout box takes about two-secs to update so you may need to tell the winch operator your target depths minus one or two meters (ie 102 instead of 100) so the CTD stops at the exact desired depth.
- When possible, go out and verify the number of open bottles upon arrival to surface. If a bottle did not close and you can ascertain the mistrip depth, send the CTD back down. But only do this for shallow bottles, say 75m or less. If all looks good, trip your surface bottle(s) and leave the data acquisition running while the CTD is retrieved.
- Once on-deck, record the final deck pressure, the click Real-Time Data/Stop, then <Ctrl><Alt>B to backup. If the backup fails, it usually because the CTD files are not in the proper directory (like settings or archived) or the cast number is wrong. Fix the problem and backup.
- Refer to "CTD Post-Cast Tasks" document for more info on post-cast duties.
2). MET/SCS data files when MET/SCS is available, YYMMSSMETEV_DDMMYYYY.csv
Note: METCapture is not typically run on NOAA vessels unless a SCS serial feed is available to the CTD data acquisition area. Instead, a GPS is attached to the CELogGPS tablet directly, providing lat-lon-date-time to the event log & network.
Several text (.txt) files are used to label this program's event activities & other parameters. The specific .txt filenames are defined in the CELogGPS.cfg file – refer to CELogGPS documentation for details.
Important note: CTDBackup uses 7-zip so a copy of 7za.exe is required in the CTDBackup dir. Also a "readme.txt" file (which can contain anything) is needed in the zip destination dirs otherwise the zip file will not be transferred - a weird but necessary requirement.
1). salt program base files (Q:\CODES\YYYY\YYMM\SALT\salt###);
2). O2 box files (###01.box; copied to the auto-titrator pc's O2 box subdir, mapped in CESL.cfg as O:\);
3). chl base files (Q:\CODES\YYYY\YYMM\chl\chl###) & filtration form; uses Excel 2010 & form template (CHLformMaster.xls, located in the local CESL dir).
4). printout of sample log
5). sta.csv & casts.csv entry
6). sta.csv & casts.csv entry
7). sta.csv & casts.csv entry
7). sta.csv & casts.csv entry
Note: a data file with multiple stations must be edited before data processing, a blank 'cup' line with sta### is entered between stations.
Bottle Sample Salinity
Bottle sample salinities are calculated in both PSal (Portasal Data Acquisition program) and DECODR, software developed by SIO-CalCOFI from Fortran source code by Mantyla & Newton.
Visual Basic source code for the calculation of salinity from conductivity :
'two conductivity values, from two Portasal cell fills; averaging 5 cond readings = 10 cond ratio readings total that must agree within 0.0004
For j = 1 To 2
cr2 = cr!(j) * cr!(j)
sqcr = Sqr(cr!(j))
deltas = (BathT# - 15#) / (1# + 0.0162 * (BathT# - 15#)) * (0.0005 - 0.0056 * sqcr - 0.0066 * cr!(j) - 0.0375 * cr!(j) * sqcr + 0.0636 * cr2 - 0.0144 * cr2 * sqcr)
sal!(j) = 0.008 - 0.1692 * sqcr + 25.3851 * cr!(j) + 14.0941 * cr!(j) * sqcr - 7.0261 * cr2 + 2.7081 * cr2 * sqcr + deltas
With datalog
.Row = currrow% 'reccnt%
.Col = 7 + j
.Text = Format(sal!(j), "0.00000")
' .Text = Str(.Col)
End With
Next j
AveSal! = (sal!(1) + sal!(2)) / 2
'References: the practical salinity scale 1978 (the unesco equation of state of seawater) , for lab salinometers
'When IAPSO Standards or Sub Standard are run, any drift! between first value a last value must be removed
salin(1, 1) = sal(1, 1)
salin(1, 2) = sal(1, 2)
For J = 1 To 2
drift = (sal(1, J) - sal(nta%, J)) / (nta% - 1)
dri = 0#
For ic% = 2 To nta%
If (cr!(ic%, J) > check) Then GoTo 609
dri = dri + drift
salin(ic%, J) = sal(ic%, J) + dri + offst
Next ic%
Next J
We never see salinities over 44 and sample the same section of ocean so we do not apply different corrections or algorithms.
Origintal Fortran code converted to Visual Basic:
Original Fortran Code:
C CALCULATE SALINITY
C
CR2=CR(IB,K)*CR(IB,K)
SQCR=SQRT(CR(IB,K))
DELTAS = (T(IB) - 15.) / (1. + 0.0162 * (T(IB) - 15.))
* * (0.0005 - 0.0056 * SQCR - 0.0066 * CR(IB,K)
* - 0.0375 * CR(IB,K) * SQCR + 0.0636 * CR2
* - 0.0144 * CR2 * SQCR)
SAL(IB,K)= 0.0080 - 0.1692 * SQCR + 25.3851 * CR(IB,K)
* + 14.0941 * CR(IB,K) * SQCR - 7.0261 * CR2
* + 2.7081 * CR2 * SQCR
* + DELTAS
C
C REFERENCES: THE PRACTICAL SALINITY SCALE 1978 (THE UNESCO
C EQUATION OF STATE OF SEAWATER), FOR LAB SALINOMETERS
C WHEN COPENHAGEN SAMPLES ARE RUN, ANY DRIFT BETWEEN FIRST VALUE AND
C LAST VALUE MUST BE REMOVED
C
DO 610 K=1,2
DRIFT=(SAL(1,K)-SAL(NTA,K))/(NTA-1)
DRI=0.
DO 609 IC=2,NTA
IF(CR(IC,K) .GE. CHECK) GO TO 609
DRI=DRI+DRIFT
SALIN(IC,K)=SAL(IC,K)+DRI + OFFST
609 CONTINUE
610 CONTINUE
Seabird Salinity Algorithm (from Seasoft 7.23.1)
Practical Salinity = [PSU]
(Salinity is PSS-78, valid from 2 to 42 psu.)
Note: Absolute Salinity (TEOS-10) is available in our seawater calculator, SeaCalc III. All other SBE Data Processing modules output only Practical Salinity, and all parameters derived from salinity in those modules (density, sound velocity, etc.) are based on Practical Salinity.
Salinity calculation:
Using the following constants
A1 = 2.070e-5, A2 = -6.370e-10, A3 = 3.989e-15, B1 = 3.426e-2, B2 = 4.464e-4, B3 = 4.215e-1, B4 = -3.107e-3, C0 = 6.766097e-1, C1 = 2.00564e-2, C2 = 1.104259e-4, C3 = -6.9698e-7, C4 = 1.0031e-9
C Computer Code –
static double a[6] = { /* constants for salinity calculation */
0.0080, -0.1692, 25.3851, 14.0941, -7.0261, 2.7081
};
static double b[6]={ /* constants for salinity calculation */
0.0005, -0.0056, -0.0066, -0.0375, 0.0636, -0.0144
};
double Salinity(double C, double T, double P) /* compute salinity */
// C = conductivity S/m, T = temperature deg C ITPS-68, P = pressure in decibars
{
double R, RT, RP, temp, sum1, sum2, result, val;
int i;
if (C <= 0.0)
result = 0.0;
else {
C *= 10.0; /* convert Siemens/meter to mmhos/cm */
R = C / 42.914;
val = 1 + B1 * T + B2 * T * T + B3 * R + B4 * R * T;
if (val) RP = 1 + (P * (A1 + P * (A2 + P * A3))) / val;
val = RP * (C0 + (T * (C1 + T * (C2 + T * (C3 + T * C4)))));
if (val) RT = R / val;
if (RT <= 0.0) RT = 0.000001;
sum1 = sum2 = 0.0;
for (i = 0;i < 6;i++) {
temp = pow(RT, (double)i/2.0);
sum1 += a[i] * temp;
sum2 += b[i] * temp;
}
val = 1.0 + 0.0162 * (T - 15.0);
if (val)
result = sum1 + sum2 * (T - 15.0) / val;
else
result = -99.;
}
return result;
}
CalCOFI uses a variety of analytical instruments to measure our oceanographic samples. Many, such as the Turner Designs 10AU fluorometer, have a RS232 serial interface that can output measurements electronically during sample analysis. This white paper will outline basic RS232 serial communication data logging techniques using a PC. This basic interface strategy should be platform-independent but all examples will be MS Windows based.
Basics terminology
-
RS232 = com port = serial port - typically a 9-pin port on computer or instrument. May be 25-pins on instruments but do not confused it with 25-pin LPT port. Seabird
Electronics CTD Deck Unit has two 25-pin female RS232 ports, for example. PCs, particularly older desktops, typically have a 9-pin male com port.


- LPT = parallel port - these terms are used interchangably and refer to a 25-pin parallel printer port on a computer or instrument.
- com = comm, you may see com port written as comm port or com program written as comm program - same thing.
- handshake - phrase used to describe the syncing of communications established between PC & instrument.
- com settings = parameters configured on the PC & in the com program to handshake and collect data from the instrument or serial device.
- com program - PC software needed to 'talk & listen' to the instrument using the com ports.
- sail or stream mode - once configured to output data, some instruments stream data out of the serial port and do not require any commands from the PC. Turner Design fluorometer for example.
- query = command sent by the com program; some instruments require a command be sent by the PC before data is sent out the serial port.
- USB-to-serial device - newer computers and laptops do not have a com port so a USB-to-Serial adapter is require to create a 'virtual serial port'. They come in a variety of configurations such as single, two, or four com ports. A software driver needs to be installed to create the 'virtual serial port(s)'.
Many instruments come with sophisticated software to control the analytical processes. Hopefully, the software is included with the instrument and is not an expensive add-on. Depending on the complexity of the analysis, there may be no alternative to the manufacturer's software. Especially if the instrument is software-driven or visualization tools are needed during the assay. But if the analytical instrument has a serial port, it may be possible to easily capture the output to a text file and import into a spreadsheet or programming language.
Hardware requirements
- Instrument that output serial data - refer to instrument documentation for specifics on achieving this such as the com port settings needed to handshake with the PC. Some instrument require the serial port output to be 'turned on' or configured; once configured, some will stream (often called 'sail-mode') data, other instruments may require a query or command to be sent before it will reply. The Guildline Portasal salinometer requires a query be sent by the PC before sending measurement data back.
-
Computer with a RS232 9-pin port or USB port (in these examples, one running Microsoft Windows XP-8.1)
- USB-to-Serial adapter, if your pc does not have a 9-pin RS232 port. Note there are two typical chipsets: Prolific and FTDI; when choosing an adapter be sure a driver is available for your operating system. We prefer FTDI which has better drivers and specs. FTDI chipsets will work well with Mac or Linux computers. (Google FTDI vs Prolific for comparison info). Prolific are often cheaper and will work with Windows.
-
9-pin null modem cable or 9-pin straight-through serial cable & null modem adapter. Note: some instruments may already have an integrated serial cable, like the Turner Design 10AU fluorometer.
- Length - typically a 10ft (3m) cable is long enough but it depends on the instrument port location & distance to pc serial port. A serial signal can travel ~50-100ft (15-30m) depending on the cable and signal quality. If you add a serial signal repeater/booster, the signal may travel up to 4000ft. (1200m).
- Gender of each connector is determined by the computer and instrument serial port gender. On the computer-side, you typically need a female (F) cable connection. The instrument end may also require a female (F) connector so you would use a F-F 10ft serial cable. A small gender changer may be used to adapt incompatible ends.
- Most instruments need a null modem to handshake properly but it is good to have a 9-pin straight-through non-null modem serial cable as well. You can use a null modem adapter (looks like a long gender changer) on a straight-through serial cable to create a null modem cable.
- 25-pin port - LPT or RS232? It is rare for newer instruments to have a 25-pin serial port - typically a 25-pin is a parallel (lpt) printer port. Check the instrument documentation if the port is not labled or you are unsure. If you see a "LPT" label, the port is for a parallel printer; if you see "RS232 or Modem" label, the port is a serial port. Do not connect a 25-pin parallel port to 9-pin serial port. If you are sure it is a 25-pin RS232 serial port, you can use a 25-pin to 9-pin cable. A null modem adapter may still be required.
-
Com program - some versions of Windows come with Hyper-terminal but we prefer Tera Term freeware. Tera Term and Hyperterminal have a log-to-file feature so any data displayed on screen can be saved to a log file.
- com port settings - in your com program, configure the settings to match the instrument. Check the instrument manual for com port settings - you will typically see something like "9600, n, 8, 1". If data appear on-screen but it is garbage, try a different baud rate such as 19200 or 4800, until you see legible text.
- when using a USB-to-Serial adapter, you may have to search the 'Windows Device Manager' for the com port number. Open 'Windows Device Manager' and look for 'Ports (Com & LPT)'. If the USB-to-Serial adapter is attached to your PC and the driver properly installed, you should see it listed. The 'COM#' next to the device name is its current com port number. The other parameters can be configured by the com program but you need this value - mine reads 'COM4', for example. If necessary, you can change this value by right-clicking the device, select Properties, Port Settings, Advanced, COM Port Setting - select the com port number you want then OK. Please be aware that this custom setting may not be saved after rebooting; when you turn off or reboot your computer, it may switch back to the original setting. If this happens, you will have to repeat these steps. The FTDI driver is better at saving setting changes.
Once you see data and can save it to a text file, you are recording your instrument's output. Importing these data into Excel or writing a parsing routine in Matlab would be the next step.
You can test your serial data collection setup by attaching a serial device like a GPS to your PC. If you are successful at seeing and logging its data, the setup should work on any instrument that outputs data. Just be sure to configure the com settings properly.
CTDBackup is a SIO-CALCOFI developed CTD cast file auto-backup utility. The CTDBackup icon on the Windows desktop is mapped to the hot-key combination <Ctrl><Alt> B. This key combination is pressed immediately upon completion of a CTD cast, once Seasoft data acquisition is stopped. CTDBackup zips all the cast files (.hex, .hdr, .mrk, .xmlcon, .nav, .bl) into a single zip file which is copied to a flash drive, backup drive or dir, & data server, if available.
Additionally, a sample log base file is created using the CTDATDEPTH event file (Q:\CODES\YYYY\YYMM\Events\YYMMCTDATDEPTH.csv) which contains the GPS date, time, lat, lon, order occupied, CalCOFI line & sta data at the time the CTD reach terminal depth. This timestamp is historically the official cast time and position reported in all data products such as Data Report and hydrographic database. If the CTDATDEPTH event file is unavailable, the .nav file date, time, lat, & lon plus .hdr file information is substituted.
Lastly, the .hdr, .mrk, .nav files are merge into a single .prn file for printing & binding with the console ops & cast plots.
Setup & Operation
| Description | CTDBackup Form |
|
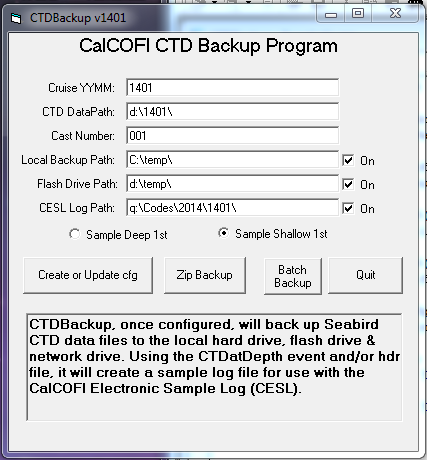
CTDBackup.cfg - CTDBackup is typically installed at C:\CTDBackup and the ctdbackup.cfg file sets the next station to zip and the default data & file paths (see image). Once the cruise information is updated in the cfg, no further editing is required unless non-consecutive numbering occurs. CTDBackup is programmed to expect sequential cast numbering 001, 002, ...;normally the CTDBackup CFG form is not seen unless there are configuration issues. If it cannot find the right cast files, it is usually because stations numbers are not consecutive or the CTD header and files were mis-numbered. If misnumbered, Quit, rename the files, then press <CTRL><Alt> B once more. The Sample Deep 1st & Sample Shallow 1st toggle changes the bottle order. In the cfg file, the values is set to 24 - Sample Shallow 1st.
|
 |
|
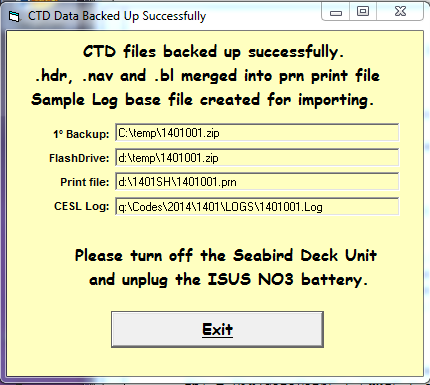
CTDBackup Success Form - when <CTRL><ALT> B are pressed in combination, the 7-zip windows will appear as Seabird cast files are zipped - do not close the dialog box before the 7-zip windows close. The CTDBackup Success form will display, listing all the backup files generated as well as the sample log base file. The first time CTDBackup is run, the user should verify the files are labeled properly and going to the right locations. This form reminds the CTD operator to turn off the deck unit and unplug the ISUS sensor battery. If the network & data server are unavailable, change the CESL Log Path from Q: to a 2nd flash drive letter. The log will not be available to the CESL tablet unless the 2nd flash drive is "sneaker-netted" to CESL. |
 |
BtlVsCTD (Bottle vs CTD) is a Windows program developed by SIO-CalCOFI. It uses Seasoft-generated CTD asc files and bottle data files (CalCOFI's sta.csv or IEH format).
In Step 1: the program averages 4 seconds of CTD sensor data prior to bottle closure then merges it with corresponding bottle data into a single csv. After removing fliers & mistrips, regressions for O2, Chl-a, & NO3 are calculated from the remaining bottle data vs sensor measurements.
In Step 2: the regression coefficients are applied to Seasoft-processed 1m binavg CTD data generating additional columns of bottle-corrected data.
Basic setup: BtlVsCTD uses a suite of in-house software to generate the necessary files:
- CTDBackup: programmed to backup & zip CTD cast files immediately after a cast, CTDBackup also generates a basic file of bottle depth data from the .mrk or .btl file for use by CESL.
- CESL: imports the sample log file generated by CTDBackup, then tabulates & annotates bottle samples, generates a sta.csv (bottle info) and casts.csv (sta info).
- DECODR: processes the bottle samples: salts, oxygens, nutrients, chlorophylls, and prodo samples; data generated populates the appropriate column(s) in the sta.csv when "update sta.csvs" is selected.
 "Sta.csvs" are created from the CTD .mrk or .btl files by CTDBackup & CESL. When bottle samples are process using DECODR, salts, nutrients, chlorophylls, and oxygens, data populate the sta.csvs for each cast.
Step 1 - BtlVsCTD uses an un-averaged CTD asc file, processed by Seasoft and the .bl file to find the bottle-trip-scan starting point. It averages 4 (or more, user-entered) seconds of data prior to bottle closure then merges the CTD data with the bottle data from sta.csv or IEH so regressions can be derived such as seen here:
http://www.calcofi.com/cruises/2015-cruises/calcofi-1507oc/575-1507oc-ctd-processing-summary.html
Refer to the Data formats page for file formats required: http://www.calcofi.com/references/data-formats.html
Once the correction coefficients have been derived interactively in Excel. BltVsCTD Step 2 applies them to 1m binavg upcast & downcast CTD asc data, generating the "Cruise_Corr" data columns.
Individual station regressions, using only bottle samples from a particular station, are also derived dynamically by BtlVsCTD. This results in "Sta_Corr" data and is considered the best bottle-corrected CTD data we generate. But this requires at least 10 bottle samples per station to work well. Otherwise, the cruise-corrected CTD data are preferred. This process is repeated once final bottle data are available.
BtlVsCTD has several other module that edit & update the CTD.csvs generated by merging CTD with bottle data.
BtlVsCTD has been around a long time and is written in Visual Basic 6. It has evolved over the years, originally using IEH-formatted data and now our sta.csvs format. This program is pretty specific to CalCOFI's file structure so it may require quite a bit of work to adapt to other datasets.
Example Step 2 Instructions - see CTD Data Processing Protocol
BTLvsCTD: Run Step 2:Correct CTD ASC data then merge w/Btl Data, DB csv out. Preliminary sta.csvs in the CSV dir or IEH (bigieh or arch.ieh) in the same dir as the CTD ASC files are required. YYMMEvents.CSV (corrected if available) also needs to be in CTD ASC dir. It is important that the Event file, if available, is cleaned up and complete. Order occupied, CTD at Depth event number, line and station numbers need to be in order & correct. Every CTD station requires a "CTD at Depth" event. If an event was not logged one needs to be added, in doing so the new event number will have an added decimal increment of 0.1 per event.
Step 2: File Selection - Navigate to the ASC folder and select all u*.ASC files. The d*.ASC files will be automatically processed concurrently. The leading d or u and trailing box are used to correctly parse the ASC file name to retrieve cruise and station numbers.
Step 2: Sensor Configuration - Using SBE CON or XMLCON files as a guide fill the Voltage Settings boxes. If different stations had different configurations (i.e., sensors were moved to different voltage positions on the CTD) process files individually with the correct fields. If a sensor was only removed from the CTD no changes are necessary as the data will be processed as 0. Fluorescence multiplier and V0 Setting have no effect.
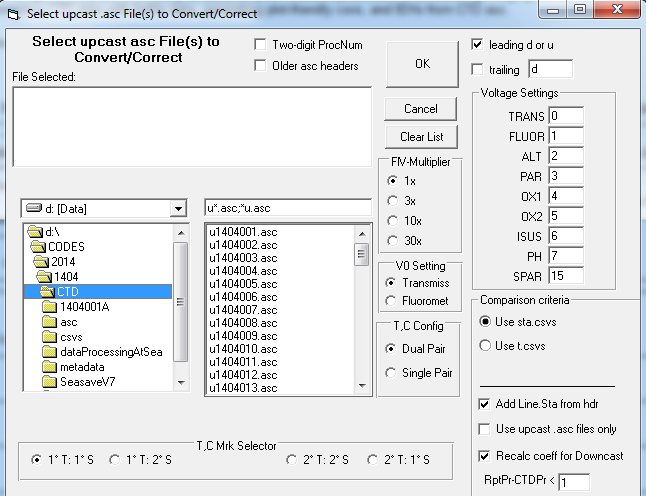
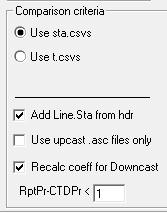 Step 2: IEH and Headers - Check the appropriate box for IEH comparison if IEH was selected on the Main Page. If Sta.csvs are used, ignore any ieh setting. Make sure you check Add Line Sta from hdr. The other two have no effect (legacy remnants).
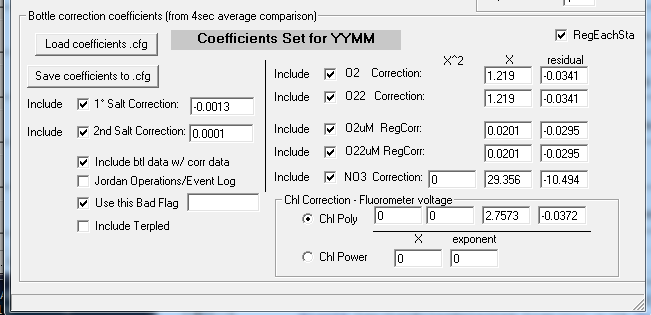
Step 2: Correction Coefficients - Replace the YYMM with the correct cruise designation by highlighting the YYMM in the Coefficients Set dialog. Check the appropriate boxes and enter the necessary coefficients for the required corrections. If a correction is not being made do not include and enter 0 in the necessary fields. Also "Include btl data..." and use the -9.990e-29 Bad Flag value to match SBE bad flags. Save the coefficient CFG to the cruise's CTD directory.
Step 2 will output station CSV files and various combined tabulations of CTD and Bottle data:
- YYMM_CTDd.CSV: compilation of all downcast CTD+bottle data, goes into CTD database
- YYMM_CTDu.CSV: compilation of all upcast CTD+bottle data, goes into CTD database
- YYMM_DBcoeff.CSV: compilation of all regression coefficients used to bottle correct CTD data; spreasheet or database-friendly, single line per up & downcast format
- YYMM_DBcoeff_used.txt: compilation of all regression coefficients used to bottle correct CTD data; text format, easy to read but not database or spreadsheet friendly
- YYMM_hdr.CSV: spreadsheet or database-friendly compilation of all hdr information in csv format
- YYMM_span.CSV: spreadsheet or database-friendly compilation of all sensor range (min - max) information in csv format
- YYMM_xmlcoeff.CSV: spreadsheet or database-friendly compilation of all xmlcoeff (sensor calibration & metadata) information in csv format
DECODR 2014: Data Processing Notes, sta.csv version

DECODR 2014 is SIO-CalCOFI's data processing suite which processes and merges the bottle & CTD data collected on each CalCOFI station. DECODR combines CTD sensor measurements with the corresponding depth bottle data into station data files (75+ sta.csvs). Station and cast information, such as weather, are stored in a single casts file (casts.csv). The casts & sta.csv formats, adopted in 2011, replaces the legacy data processing file formats based on 128-col computer punch cards: 00, 20, 22, W3, stacst, wea & IEH. The SIO-CalCOFI hydrographic database, Cruise Data Reports, and IEH archive data files are products generated by DECODR from casts.csv and sta.csvs.
CTD Data
CTD data processing is done using Seasoft, Seabird's data processing software (please refer to the CTD Data Processing Manual for specifics). DECODR 2014 will import 1m (or 4-second) binavg matching-depth CTD data into the sta.csvs. Early in data processing, the importing of CTD data is very useful for bottle vs CTD data quality control. The early cross-checking of bottle and CTD data expedites data quality assessment for both data types, discreet seawater samples and electronic sensor measurements. When compared on the cruise, early detection of bottle mistrip issues or sensor failure is possible.
Once bottle data are final, these data are used to bottle-correct the CTD sensor data. The preliminary CTD data in the sta.csvs, used during point-checking, are replaced by final, bottle-corrected CTD sensor data and hybrid (bottle and CTD) data products are published. Standard depth data, which may be interpolated when necessary, are often replaced with bottle-corrected CTD sensor measurements (temperature, salinity, and oxygen).
Seawater Sample Processing
 Each sample assay generates a data file for each station - some assays may combine multiple stations in a run into one file. These data files reside in specific directories for each data type. Each data processing module will parse the runs in their respective subdirectories and build a station list to process.
Processing all of one sample type is performed in batch, in similar fashion, for each datatype: salts, oxygens, chlorophylls, nutrients, and primary productivity samples. Stations may be processed in smaller groups or individually by checking or unchecking the station(s) to process. Each data processing module generates an output file of calculated measurements for examination and assessment of data issues & quality.
Each processing module ingests data files generated during the analysis of each seawater sample. As needed, the data files are manually 'cleaned-up' - edited and corrected - using a text editor such as Ultraedit then reprocessed. The output from edited files are once again checked for data quality and the process repeated until the data files are consider 'point-check ready'. Then the data from each assay are merged into station files (sta.csvs) by rerunning each DECODR modules with the 'Update CSVs' option checked. This populates the casts.csv with cast information and sta.csvs with bottle data.
Datacodes are used to annotate the best data for publication. By default, bottle data are data coded for use to generate Data Reports, database csvs & IEH generation.
Casts.csv and sta.csvs are located in the CSV subdirectory. Each module run with generate backup files archived in the CSV\BAK subdir. Each backup is timestamped & flagged with the data update type.
DECODR Basics
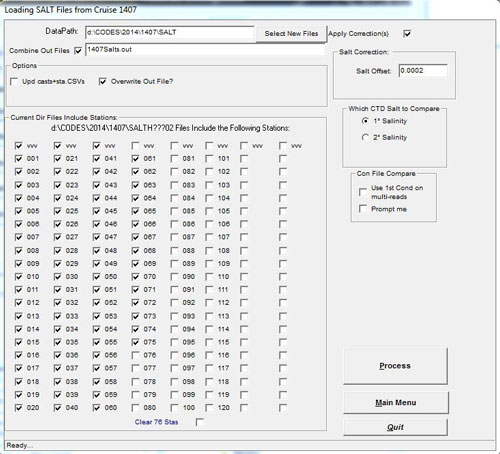
- Process Salts, Update Casts+Sta.csvs unchecked, will generate a bottle salt outfile with CTD 1° salt values from Portasal sample run files (Salt###). A salinity offset may be applied to selected stations if there is a noticable drift in the Sub Standard. The salinity offsets applied will be tabulated in the casts.csv (YYMMcasts.csv) for each station. Other options include 'Use 1st Cond on Multi-Reads' - when there are multiple reads, the 1st is often considered the best when subsequent conductivity readings drift upwards. Comparing the bottle salinity to primary or secondary CTD salts may help resolve drift issues. Once any problem with the salt files are corrected, re-run the salts with the Update Casts+Sta.csvs checkbox checked. The salt data output will be added to all the selected station csvs. This update may be performed on sta.csvs repeatedly but bottle data updates of any datatype should not be performed on terpled.csvs (t.csvs). SDC will be set to '0'.
- Process Oxygens, Update Casts+Sta.csvs unchecked, will generate an oxygen outfile from oxygen auto-titrator sample run files (YYMM###). This module has a Recalculate Normality option. Assess sample correctness using the outfile then manually correct individual oxygen files using a text editor. Once resolved, re-run the oxygens with Update Casts+Sta.csvs checked. This will add bottle oxygens to all the selected station files. This may be performed on sta.csvs at any stage of the data process except terpled files (t.csvs). ODC will be set to '0'.
- Process Chlorophylls, Update Casts+Sta.csvs unchecked, will generate a chlorophyll outfile from (FLog) chlorophyll fluorometric analysis files. This module has data processing options for Blank, Tau and Acid Ratio. Assess sample correctness using the outfile then manually correct individual chl files using a text editor. Once resolved, re-run the chlorophylls with theUpdate Casts+Sta.csvs checked. This will add bottle chlorophylls and phaeopigments to all the selected station files. This may be performed on sta.csvs at any stage of the data process except CSL-terpled files. CPDC will be set to '0'.
- Process Nutrients, Update Casts+Sta.csvs unchecked, will generate a combined nutrient outfile from QuAAtro data txt files (YYMM###.txt or YYMM###R#.txt). Adjust the data processing parameters on the right, particularly the MDL ranges and options. Combined station runs need to be delimited by a "STA###" line separating one station from another. Assess data quality using the outfile then manually correct the appropriate run.txt file using a text editor. Once resolved, re-run the nutrients with Update Casts+Sta.csvs checked. This will add core nutrients and ammonia to all the selected station csvs. This may be performed on sta.csvs at any stage fo the data process except CSL-terpled files. NDC & NHDC will be set to '0'.
- Process Prodos, Update Casts+Sta.csvs unchecked, will generate a primary productivity outfile. Processing prodos requires the correct importing of the scintillation counter file using DECODR module Import Scint. Counts to generate YYMMscin.csv. This module has fields for Specific Activity and Blank coefficients, and different scint data filenames. Assess sample matching correctness using the outfile then manually corrected individual prd files or scint asc file using a text editor. Once resolved, re-run the prodos with Update Casts+Sta.csvs checked. This will add 14C uptake data to all the selected prodo station csvs. This may be performed on sta.csvs at any stage of the data process except CSL-terpled files. C14DC will be set to '0'.
-
Import CTD .btl files. Run DECODR's [CTD Data to CSV] module and select .btl files. Btl files should be generated by the primary CTD data processor & include the CTD sensor & derived data fields listed below. The default settings should be fine for the update. CTD preliminary asc files or bottle-corrected CTD.csvs will be used for subsequent CTD data updates.
- To generate .btl files - run Seasoft's Datcnv module and select 'create bottle (.ROS) file' under Data Setup; Scan range offset = -4, Scan range duration = 4. Be sure to select all data needed to derive the CTD data columns. This will generate .ros files for each cast.
-
Run Seasoft's Bottle Summary with the following Averaged CTD sensor data & Derived data.
- Averaged variables: Scan Count, Julian Days, Depth salt water m, Pressure digiquartz db, Temp 1 ITS-90 degC, Temp 2 ITS-90 degC, V0 - V7, Beam Attenuation Seatech, Beam Transmission Seatech, Fluorescence Seapoint, pH, Lat deg, Lon deg
- Derived Variables: Sal 1 PSU, Sal 2 PSU, O2 SBE 43 ml/L, O2 SBE 43 2 ml/L, Density sigma-theta Kg/m^3, Density 2 sigma-theta Kg/m^3, Oxygen SBE 42 % saturation, Oxygen SBE 42 2 % saturation, Potential Temp ITS-90 deg C, Potential Temp 2 ITS-90 deg C
- Be sure the 'Output min/max values for averaged variables' box is checked along with 'Apply Tau correction'. This will generate the .btl files which can be imported into the sta.csvs.
-
Import CTD .csv files. Run DECODR's [CTD Data to CSV] module and select .csv files. CTD.csv files should be generated by the primary CTD data processor. These are the bottle-corrected CTD + bottle data csvs generated by BtlVsCTD step 2. The default data options for the different data types should be good unless you are comparing legacy data to sta.csv data, then select 'do not update the primary & secondary temperatures'. This will improve the agreement since 4sec .btl data are considered closest to bottle data. All derived bottle data use these temperature to generate the calculated values such as SVA.
- For the first update, select Update Bottle Depths Only. This will update the CTD data in the sta.csvs - use the selection matrix to pick the desired data such as Corrected Primary Salinity & Sta Corr Oxygen.
- Then select Add CTD StndLvls, Terple Bottle Data is automatically included. If you want the SDC & ODC codes to be set as '1' for CSLs, select those options in the Data Codes. When standard levels are inserted, new sta.csvs are generated, preserving the observed data sta.csvs for further updates. These files are named YYMM###t.csv.
- Point-check the CSL-terpled YYMM###t.csvs but correct YYMM###.csvs. If CSL-terpled csvs are corrected, interpolated bottle values will not be re-interpolated. This may be a future feature but for now all corrections should be applied to observed data files only.
- Update sta.csvs then generate final CSL-terpled t.csvs by re-running DECODR's [CTD Data to csv] module with final sta.csvs and Add CSLs StndLvls & Terple Bottle Data boxes checked.
-
Generate data products
- Cruise Data Report using Data Rpt from CSVs module
- Cruise Primary Productivity Report using ProdoRpt from CSVs module
- Horizontal & Vertical Section Plots using Horizontals & Verticals Contouring modules
- Database Bottle & Cast csvs using Sta.csvs>bottledb.csv & Casts.csv>castdb.csv modules
- IEH using Make IEH from CSVs module
General Notes:
DECODR uses C:\DECODR\decodr.cfg to configure the program. It is mandatory for it to be in that specific dir. The executable may be run from any location but the cfg file has to be local. The default datapath is the root data dir YYMM. The SUMMARY dir datapath is set by changing the '0' to '1' in cfg line 9. Or by selecting the SUMMARY box in DECODR's main window (upper right).
decodr.cfg explained
| Settings | Description |
| 1411 1407 1404 1402 1311 | Current Cruises being processed |
| 1407 | Last cruise picked |
| C:\CODES\2014\1407\ | Default datapath; SUMMARY directory is retired* |
| C:\CODES\2014\1407\ | Datapath of last run |
| C:\Decodr\ | Decodr default exe path |
| 100 | Max salinity samples per data file |
| JRW DMW JLW DNF MGS | Initials of Primary Processors |
| 22.5 1.80 45.0 0.75 3.00 | Nutrient Standard Concentrations - format is important! xx.x x.xx xx.x x.xx #.## |
| 0* | Summary dir? 0=No, 1=Yes (Retired in 2011) |
There are two version of CELogGPS - the newest version of CELogGPS uses a touch-screen PC or tablet with very little (virtual) keyboard interaction and a plainer version which also requires little key-entry once configured. But the user-interface is not as graphical or touch-friendly.
This web page describes the configuration and operation of the original version of CELogGPS that is configured by a variety of text files (.txt). This version can also be used on a touch-screen tablet but is not optimized for that style of input.
CELogGPS (CELogGPS1806.exe; download link) is a SIO-CalCOFI Windows program that records cruise events and activities timestamped with GPS date-time-lat-lon. Other notable events such as marine mammal-avifauna sightings, CUFES, or any data-generating activity may also be recorded. The GPS position is either logged directly into the PC running the program or is available on a shared network directory:
-
Obsolete - The MET string is still an option as a GPS source but CalCOFI does not run METCapture on its cruises anymore.
On SIO vessels, the MET (meterological system) string provides GPS data. A workstation is setup to run MetCapture, another SIO-CalCOFI program, that collects the MET data and appends event numbers when updated. METCapture saves the current MET string (with GPS date-time-lat-lon) to a file (currpos.csv) on the shipboard data network that all eventlogging workstations can harvest. Please review the METCapture documentation for more info. (Standard GPS input is acceptable; METCapture can log GPS instead of MET data or the GPS feed may be connected directly to the CELogGPS tablet serial port.) - GPS via com port is expected in some form, either from a ship feed or a USB GPS attached directly to the CELogGPS computer or tablet. One PC can provide the GPS data (currpos.csv) to a networked data server shared directory and other eventloggers on the same network can harvest the GPS position. See the GPS settings section below for setup information. We currently use model: GlobalSat BU-354 USB GPS Receiver with SiRF Star IV based Serial GPS receiver with WAAS/EGNOS support for enchance position accuracy when a ship GPS serial feed is unavailable.
Setup & Configuration
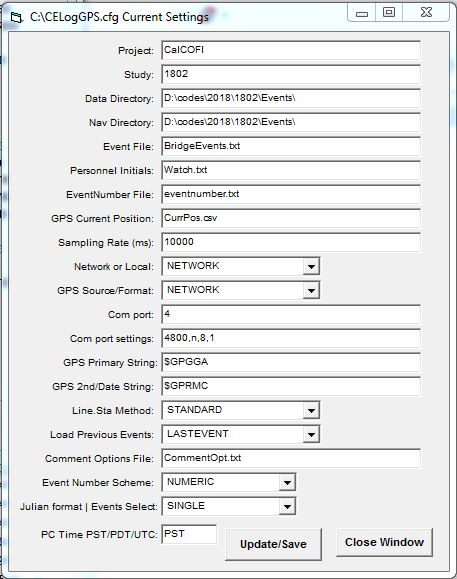 The events list & form options are configured by text files defined in the CELogGPS.cfg, which may be edited from the Config/Edit CELog.cfg menu (see figure):
- Project - cruise name such as CalCOFI or LTER Process
- Study - YYMM for CalCOFI (ie 1802) or unique cruise designation for non-CalCOFI cruises. The program works best with YYMM.
- Data Directory - location where the data will be saved. On CalCOFI it is in the events dir (Q:\CODES\YYYY\YYMM\Events).
- Nav Directory - location of the GPS Current Position file (see GPS cfg below, ie currpos.csv) either GPS or MET string; see GPS Source and GPS primary & secondary strings explained below.
- Event File - A text file listing up to 30 events can be composed for any activities generating data on the cruise. Different workstations can have different activities lists; each workstation will save an YYMMevents.csv locally and contribute to the cruise's master activities.csv. Use unique names for each different events list ie LabEvents.txt, BridgeEvents.txt, MarineMammal.txt, InstrumentEvents.txt.
- Personnel Initials - a text file with one set of intials per line for each event logger ie watch.txt. Different workstations can have different initial files since the watch.txt file is stored and accessed locally.
-
EventNumber File - a text file containing a chronological, incrementing number which all event loggers on the shipboard data network share & contribute (increment) ie eventnumber.txt. If Event Number Scheme is set to Julian, then chronological event number are not used. The Julian format is Julian Day-of-the-Year+local time (ie 218:1102 if Julian format is set to Single or Short; to include seconds set Julian Format to Long).
The Julian Event Numbering is useful when multiple copies of CELogGPS are run on independent computers. Julian event numbering should generate unique event numbers so individual event logs could be merged into a single cruise event log then sorted chronologically. - GPS Current Position - GPS data source file name ie currpos.csv - note that straight GPS output is not csv but the filename extension is, regardless. Please refer to the GPS Source/Format section for format information.
- Sampling Rate (ms) - 15000 ms = 15 secs, the frequency which CELogGPS queries the GPS Current Position file (currpos.csv) and EventNumber file (eventnumber.txt) for new values. If you are having "file not found" issues then make this value longer ie 30000 (30 secs) or check network connectivity. If GPS is harvested off a networked dir, be sure the shared networked dir is mapped to a drive letter (ie Q:\) set in the cfg (Nav Directory) & the dir shows up in Windows File Explorer.
- Network or Local - toggle for LOCAL or NETWORK connectivity. NETWORK is the default since the GPS Position File (currpos.csv) & Eventnumber file (eventnumber.txt) are typically shared on the shipboard data network. Change to LOCAL when the network is unavailable, the event log is used independently, or the GPS is being logged & shared by the local workstation.
-
GPS Source/Format - although GPS is pretty standard, sometimes it is necessary to distiguish different ships or sources:
- NETWORK - CELogGPS will look to a shared, mapped network drive/directory (ie E:\ or Q:\CODES\2018\1802\Events\ on CalCOFI cruises) for the GPS Position File (currpos.csv).
- GPS - a GPS is attached locally; this workstation can act as host & copy its GPS Position File (currpos.csv) to a shared, mapped drive/directory. When set to GPS, the GPS com port setting dialog will display - refer to the GPS settings section for setup information.
- MET - same as GPS but the GPS Position FIle (currpos.csv) is in MET-format.
- SCS - the GPS Position File (currpos.csv) is in in NOAA SCS-format; this option may need additional programming since it has not been used for years.
- UDP - requires a UDP virtual serial port driver and GPS feed via UDP over ethernet; may require programming tweaks to work.
- KNORR - same as UDP, requires a UDP virtual serial port driver and GPS feed via UDP over ethernet; used on an early LTER Process cruises & may require programming tweaks to work.
- JD - obsolete, RV David Starr Jordan NOAA bridge log GPS format
- Com Port - for a direct GPS connection; # of the com port the GPS is connected (ie 2); note: that the com port # assigned when using a serial to usb adapter may change whenever reinstalled. Check the Windows Device Manager (under Control Panel) for current address, remap or reconfigure as needed. If set correctly, the GPS feed will display in the GPS window.
- Com post settings - usually 4800, n, 8, 1 for USB GPS
- GPS Primary String - GPS string used for Lat & Lon; currpos.csv must contain this header ie $GPGGA. Other headers in the currpos.csv are ignored except the GPS 2nd/Date String (see next). If the GPS lat lon fields are incorrect, check the GPS feed is working and what strings are available.
- GPS 2nd/Date String - GPS string used for GPS Date & Time; currpos.csv must contain this header ie $GPRMC. If the GPS date time fields are incorrect, check the GPS feed is working and what strings are available.
-
Line.Sta Method - CalCOFI line and station data can be determined three ways:
- STANDARD - using latitude-longitude, Line & Sta are calculated and compared to the standard line.sta table. The nearest standard line.sta numbers are entered in the form & data file. Note: the calculated Line & Sta are also saved to the events.csv.
- CALCULATE - using latitude-longitude, Line & Sta are calculated and the calculated line.sta are recorded; useful for non-CalCOFI cruises in the CalCOFI grid
- SELECT - Line and Station are selected manually by the user from the Lines.txt file.
-
Load Previous Events - when restarting CELogGPS, how many previous entries to reload
- CURRENTSTA - will reload all the current station's logged events
- LASTEVENT - will reload just the single record of the last event recorded
- ALLEVENTS - will reload the entire cruise events log
- LASTSTA - will reload all the last station's events; default setting
- Comment Options File - the three options boxes typically Station Type, Sea Conditions, Day/Night are configured by text file listed here ie CommentOpt.txt.
-
Event Number Scheme - to create unique event number IDs or indexes for a cruise, chronological or Julian numbering can be used.
-
NUMERIC (default) will set the event number as numeric and chronological ie 001, 002, 003...
-
JULIAN is used for standalone loggers on the same cruise that are not networked, not using a shared eventnumber.txt file. If JULIAN is selected, the next field Julian format's LONG or SHORT affects the length of Julian time recorded as the event number.
-
SHORT result in DOY.HHMM, which is Julian Day of the year, with Jan 1st = 1; Dec 31st = 365; HHMM current time in hour & minutes.
-
LONG adds seconds to Julian Time so the event format becomes DOY.HHMMSS. LONG is used if cruise events may occur at the same time on a minute-scale so need to be resolved by seconds.
-
-
-
Julian format | Events Select - this option contains two separate feature options (which should be separate - next version perhaps). Julian format is described in the last entry JULIAN. LONG or SHORT affects the timestamp length. Completely separate (and almost forgotten) is the MULTI or SINGLE option added quickly for the Marine Mammal users.
-
MULTI - will convert the events selection list on the right to checkboxes. This allows more than one selection to be recorded - events will combine/append in the order of selection. Marime mammal observers created a sightings event list so events could be a combination of selected options.
-
SINGLE - default - only one event is selected at a time.
-
-
PC Time PST/PDT/UTC - CalCOFI logs all data collected & events on Pacific Standard Time (PST). Computers that run CELogGPS may be set to PDT or UTC so this setting applies a time offset automatically without changing the computer's clock. All CalCOFI data acquisition computers are set to PST all year long but we often run CELogGPS on the shipboard CTD data acquistion computers. On RV Sally Ride, all the data acquistion computers are set to UTC; on other ships, depending on time of the year, computers may be set to PDT. This option will apply an offset to the event time based on the setting - if NO correction is desired, set this to PST.
Notes - these options are easily changed using the Config menu in the upper left.
Three files are required by CELogGPS and usually reside in the shared, mapped network Events dir: currpos.csv, eventnumber.txt, orderocc.txt. OrderOcc.txt increments automatically when the Station Arrival event is recorded. OrderOcc's numbering can be off if Station Arrival is not recorded or recorded too many times.
Operation
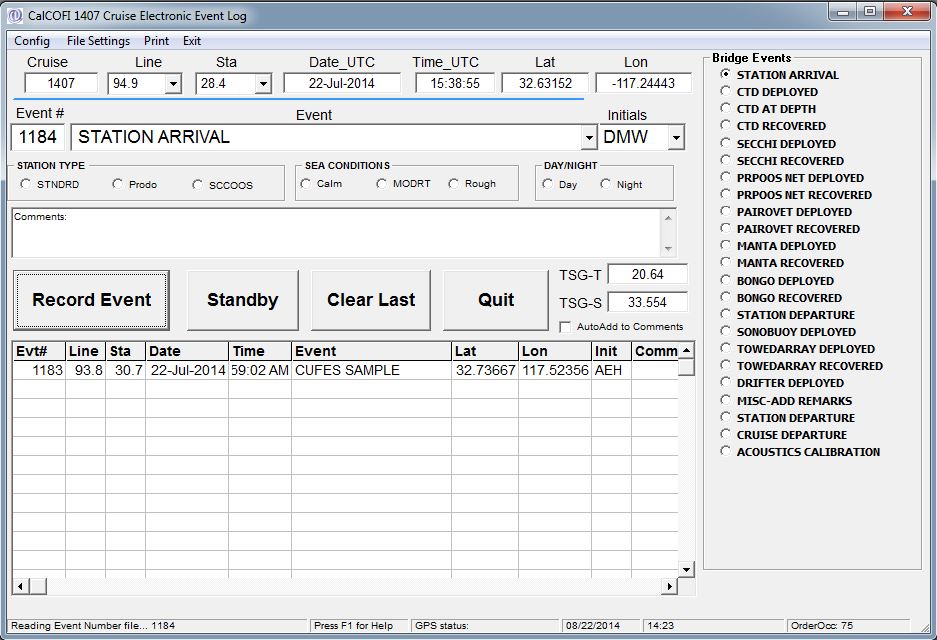 Once configured, CELogGPS requires very little keyboard interaction. Event selection may be done from the list by stylus, mouse, or trackball. Once an event is recorded, the cursor automatically moves down to the next event on the list and is selected ie after CTD DEPLOYED is recorded, CTD AT DEPTH is auto-selected as the next event. Compose your events list to use this feature to simplify the event selection process and be aware the cursor will move automatically. Our events list is composed with a typical CalCOFI station sequence in mind: STATION ARRIVAL, CTD, secchi, vertical nets, towed nets, and misc other data-generating activities.
- Click [START] to begin - the GPS fields should fill and update every 15 seconds (depends on GPS or MET update frequency).
- Select an event then click [RECORD EVENT]; only one event may be selected from the list at a time unless the MULTI option is selected when configuring CELogGPS or Config/Checkbox mode is selected in the menu.
- Any event may be key-entered into the Event field by selecting it then typing. Using a static list helps standardize vocabulary but custom entries may be key-entered at anytime. Especially for rare events such as whale, market or Humboldt squid encounters.
- [STANDBY] - CELogGPS monitors the currpos.csv and eventnumber.csv files every 15 seconds. STANDBY will PAUSE the continual querying of those files until RESUME is clicked.
- [CLEAR LAST] - will remove the previous entry from the screen and place an "erase last entry" comment into the events data file. Whenever an incorrect event entry is recorded, use this button to remove it, then select and record the correct event using [RECORD EVENT].
- Options Station Type, Sea Conditions, and Day/Night are available to streamline entry of general comments often observed, minimizing the use of keyboard. When the options are selected, they are automatically entered into the Comments box. Additional comments are welcome - select the comments field and key-enter any relevant comments using the keyboard.
General Notes
At the bottom of the CELogGPS form are several fields (from left to right): comments-status, F1 for Help (needs work), GPS Status, Date PST, Time PST, Order Occ.
Please record all events possible even if they are well after the actual event time. It is useful to annotate "late-entry" into the comments field to identify late events so date-time & lat-lon can be corrected from log sheets or other sources when available. The main purpose of the event number is to assign a unique identifier to data generating activities on a cruise. It also functions as a cruise journal, highlighting sequences of activities, recording unique or rare events, and to record time & position of general cruise events.
CELogGPS saves the events in a couple ways - locally in the C:\CELogGPS dir - it saves an event-specific csv such as YYMMStationEvents.csv. It also contributes to the shipboard data network master events file YYMMEvents.csv. CELogGPS also saves a html version of the events file since opening the events csv in Excel will lock the file, making new entries impossible and the program crash. So if you must open the events.csv, copy it locally and open it on your own workstation. Do not open the shared network version.
The CELogGPS screen should display all events recorded by any networked event logger - this is useful in situations like if Aft Control forgets to do a CTD AT DEPTH event, the CTD operator can see the event is missing & record one.
Other features -
- double-clicking the Events frame title will open the events editor, allowing event editing or new entries.
- Events are recorded to the data file right away - the file is open, entry written, file closed so erasing an incorrect entry has to be done manually after the cruise.
- Under the File Settings menu, the location and filename of the OrderOcc File, EventNumber File, Position File are available for verification.
Latest Changes
v1711 - added a PC Time PST/PDT/UTC offset option
v1407 - added MET TSG Temperature & Salinity display to the activities form. These were added for the CUFES personnel to key-enter those values when their MET feed was not working. When checked, the 'autofill to Comments' will add these two values to the eventlog event comments field.
 Corrected Conversion Algorithm for CalCOFI Station Grid And Their Implementation in Several Computer Languages by Edward Weber & Thomas Moorem, NOAA Fisheries, 2013 CalCOFI Report v 54.
 Matlab scripts by Robert Thombley, SIO-CalCOFI with Sep2014 error correction by Augusto Valencia, UABC; based on Weber & Moor 2013.
Link to MatLab downloadable code authored by Robert Thombley, SIO-CalCOFI
(Abstract from pdf) "Converting between geographic coordinates in latitude and longitude and the line and station sampling pattern of the California Cooperative Fisheries Investigations (CalCOFI) program is a commonly required task for conducting research on the California Current ecosystem. This note presents several corrections and clarifications to the previously published algorithms for performing these conversions. We include computer code to implement the algorithms in Java™1, Perl, Python, and R. We note that freely available code to conduct the conversions in Fortran, Matlab®2, JavaScript™, and Visual Basic®6 has previously been published, and an online conversion tool is also available. A future version of the PROJ.4 cartographic projections library will also include support for CalCOFI conversions, thereby allowing for convenient conversions using the GRASS GIS, PostGIS, Python, Perl, R, and many other programs and programming languages."
For individual language - Java, Perl, Python, or R - implementations & downloads, see the algorithms page
CESL (pronounced Cecil, after the sea-sick sea serpent cartoon character  ) is CalCOFI's Electronic Sample Log, which replaces the traditional clipboard and sample log form.
BASICS
 CESL auto-loads the bottle depth information from a base file created by the CTDBackup program from the CTD cast files. CTDBackup uses the .mrk & .hdr files plus CTDATDEPTH event (.csv created by CELogGPS) to build the CTD cast's seawater sampling scheme that fills the form. This is a live, dynamic document that the watchleader should check, edit, comment, annotate, & revise to accurately log all seawater samples taken plus any sampling notes or issues.
Important note: the .mrk file must accurately report the bottle closures - if any extra markers were generated or markers missed then the .mrk file should be edited before CTDBackup is run. Refer to CTDBackup for additional info.
CESL expects station numbering to be consecutive (001, 002, 003...) and requires a base file generated by the CTDBackup (<Ctrl><Alt>B) program. If a base file is unavailable, the station cast info may be entered manually (line.sta, order occ, total # of bottles closed) then the sample log completed & saved normally.
O2 case, salt case, and nutrient rack color are selected from the drop-down boxes by the watchleader or sampling team.
Bottle options, such as LTER Salt Only or MISTRIP, may be selected for a bottle by double-clicking the niskin or sample number at a particular depth then selecting from the pop-up list (see the alternate bottle section below). Once all seawater samples are drawn, sample drawers initials added, and all fields checked for correctness, click [Save] (or menu File/Save Everything or <Ctrl>S). This will save & print the log for station bookkeeping, generate the individual sample assay files (Salt, O2, Chl) , & generate data processing csvs.
[Save] does the following:
-
 Sample form is saved to the data server (Q:\CODES\YYYY\YYMM\logs\YYMM###slog.csv) & printed to the default printer (SIO-CalCOFI laser printer). The sample form may be reloaded into CESL anytime by entering in the processing number. Corrections, annotations, &/or revisions done then resaved/reprinted.
 - Oxygen box file - an O2 box file (O:\###02) that will preload the O2 flask number and draw temperature into the autotitrator program is created and copied to the oxygen titration computer. The O2 computer must be networked & mapped to a drive letter (usually O:\) so CESL can copy a the box files to the autotitrator's box subdir.
- Salt base file - a salt base file (Q:\CODES\YYYY\YYMM\Salt\Salt###) is saved to the data server for use by the PSAL salinity analysis program.
- Chl base file & filtration form - a chlorophyll base file (Q:\CODES\YYYY\YYMM\Chl\Chlt###) is saved to the data server for use by the FLog chlorophyll analysis program. Using MS Excel, CESL pre-fills a chlorophyll filtration form with chl vial numbers (starting vial # comes from CESL.cfg), filter-time (CTD cast time +1 hr) and operator (1st O2 initials), and fluorometer (from CESL.cfg).
- CESL generates the sta.csv & casts.csv entry for each station during the [Save] process. The sta.csv (YYMM###.csv) will be populated with CESL's (.mrk file) depth, temperature, salinity, annotations, footnotes, and comments. CESL's station information plus processing and event numbers will save into the YYMMcasts.csv. The sta.csv and casts.csv are the primary data files used during data processing so it is critical the watchleader verify the information before saving especially order occupied, line.sta, date-time-lat-lon, event number, and sample numbering.
YYYY = year; YYMM = year month cruise designation; ### = order occupied
Note: any step of the log or file saving sequence may be performed separately by using the menu File options - see image.
Oxygen samples draw temperatures may be entered surface to deep by first double-clicking the surface bottle O2 draw temp cell. CESL will ask if you want to enter temperatures in reverse order - click YES. (This method is preferred over having CTDBackup fill the form in reverse order, surface bottle at row 1). When entering the O2 draw temperatures, the decimal is not required if <Enter> is hit instead of mouse-clicking. Also when <Enter> is hit, the draw temp plus other depth info is saved into an insurance file which can be reloaded if the program crashes by pressing <F3>.
If the salt or nutrient samples are continuing a case or rack, enter the starting sample bottle number in row 1 (of the salt or nut field) then hit <Enter>. You will be prompted to renumber the rest of the column automatically.
Double-clicking a comments field will bring up the comments editor. Please use a semi-colon as text separator since the saved form is comma-delimited. This rule applies to any cell where entries are delimited (e.g. initials, DIC bottles).
Subcategories
CalCOFI Handbook
The CalCOFI Handbook is a compilation of information for cruise participants. It explains many aspects of the science performed at sea, particularly the sample drawing methods for each sample type.
Data Formats
CalCOFI Data File Formats
Methods
CalCOFI standard practices for sample analysis, data processing, metadata & general methodology.
Software
SIO-CalCOFI software used at-sea and ashore, developed by the SIO CalCOFI Technical Group. Plus other software: auto-titrator oxygen analysis software developed by SIO's Ocean Data Facility; Seabird Seasoft & Data Processing software; Microsoft Office, Ultraedit, Ztree, hxD hex editor, Matlab, Surfer, Ocean Data View.