-
 The sample bottle number should ALWAYS match the rosette bottle number on full casts – check and re-check this during the sample drawing process. If you ever have any doubt about the sample, dump it and start over. Shallow casts with fewer than 20 salt samples may be combined with a previous station. Check with the watchleader & sample log for the correct sample bottle numbering.
- The sample bottles are stored inverted – they should not be turned over until the new sample has been taken. If you need to step away from sampling for any reason and have not filled the sample bottle, return it to the case inverted.
- The bottles should never be stored empty so as the old sample is dumped, use it to rinse any salt that may have crystallized on the threads, thimble, and cap.
- Salt samples are usually drawn from the bottom valve. Fill the bottle with ~40mls of seawater, cap loosely, shake then dump, rinsing the threads and thimble (plastic insert). Repeat – you should rinse the bottle 3 times; the dumping of old sample does not count as a rinse.
- The last fill should be done without interruption until overflowing, filling the bottle completely; pour ~10ml out over the thimble, place it firmly in the bottle and cap. The caps are brittle and should not be over-tightened. If they crack, retrieve a replacement from the spares Ziploc, keeping the thimble in place. See photo for optimal fill height.
 Frequently Asked Questions About Fluorometric Chlorophyll Analysis
Q: Why measure chlorophyll?
A: All plant life contains the primary photosynthetic pigment chlorophyll a. Microscopic, planktonic plants, or phytoplankton, occupy the lit zone of all water bodies. With over 70% of the surface of the earth covered in water, phytoplankton and photosynthetic bacteria are responsible for almost ½ of the planets primary production while their total biomass comprises less then 1% of the total plant biomass. These extraordinarily efficient plants also act as the single largest CO2 sink on earth. For these reasons alone it should be clear that there is an interest in measuring concentrations of phytoplankton. Chlorophyll a fluorescence is the most versatile, sensitive and easy way to measure the concentrations of phytoplankton in water.
The quantitation, through extracted analysis, or estimation, through in vivo analysis, of chlorophyll a concentration supplies information on the abundance of phytoplankton present in all aquatic environments. Since chlorophyll-containing organisms are the first step in most food chains, the health and /or abundance of these primary producers will have cascading effects to all higher organisms. Therefore, the determination of chlorophyll concentration is one of the key indices in monitoring the health of any natural system.
Chlorophyll measurements are also used to directly monitor phytoplankton populations. Examples include, but are not limited to, the monitoring of chlorophyll in natural marine and freshwater environments, reservoirs, water and sewage treatment plants, and aquacultural systems.
Q: How do fluorometers detect and quantify chlorophyll a in water?
A: Fluorescence is the phenomena of some compounds to absorb specific wavelengths of light and almost instantaneously emit longer wavelengths of light. Chlorophyll a naturally absorbs blue light and emits, or fluoresces, red light. Fluorometers detect chlorophyll a by transmitting an excitation beam of light in the blue range (440nm for extracted analysis and 460nm for in vivo analysis) and by detecting the light fluoresced by cells or chlorophyll in a sample at 685nm (red). Generally, this fluorescence is directly proportional to the concentration of the material in question.
Q: What is the difference between in vivo, in vitro , and extracted chlorophyll analysis?
A: In vitro (meaning 'in glass' and referring to 'in an artificial environment or outside the living organism') chlorophyll analysis is another term for extracted analysis. It entails the concentration of chlorophyll containing cells onto a filter followed by the extraction of the chlorophyll a from the cells. In vivo (meaning 'within a living organism') chlorophyll analysis simply refers to the analysis of chlorophyll in the natural environment or, in our case, in the living algal cells.
Q: What is in vivo chlorophyll analysis?
A: In vivo chlorophyll analysis is the fluorescent detection of chlorophyll a in living algal and cyanobacterial cells in water. In this technique, the excitation light from the fluorometer passes through the untreated sample water and excites chlorophyll within the living cells of the algae present. There are several factors that make in vivo analysis a semi-quantitative measure at best. Environmental parameters, physiology, morphology, light history and the presence of interfering compounds all play a role in altering the relationship between fluorescence and the concentrations of chlorophyll a. Examples of interfering materials include other plant pigments, degradation products, dissolved organic matter, and turbidity. In vivo fluorescence data supplies information on the relative distribution of chlorophyll concentrations and usually correlate well with extracted chlorophyll a samples.
In vivo detection has several very useful applications. An example is the monitoring of general trends in chlorophyll concentrations in real time. It is very easy to obtain large amounts of data using in vivo instrumentation and is an excellent means of following trends and estimating chlorophyll concentration. With the introduction of the Wetlabs® submersible fluorometer, verticals profiling and mooring applications are now possible. Other examples of in vivo applications include continuous monitoring along a ship's track using the 10-AU configured with a flowcell and discrete sampling used to monitor algal concentrations in natural or laboratory phytoplankton populations. Examples of discrete sampling applications include aquaculture and hatchery systems, water treatment facilities, reservoir monitoring, and aquatic research (see the Aquafluor™).
If water samples are taken, the in vivo data can be correlated to extracted chlorophyll a data to estimate actual concentrations. Otherwise, the in vivo data can be used as a relative measurement to identify trends and patterns.
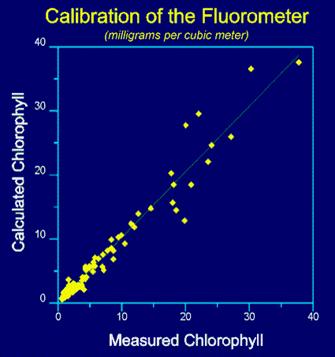 Q: How do you calibrate a fluorometer for extracted chlorophyll-a analysis?
A: Allow the fluorometer to warm-up for the time specified in the User's Manual. Measure the fluorescence of each standard at sensitivity settings that provide mid-scale readings (refer to your User's Manual for proper calibration procedures). Follow directions under section 10.0 from E.P.A. Method 445.0 (Revision 1.2) for the calibration and standardization procedure using the traditional acidification technique or the non-acidification method. E.P.A. Method 445.0 calls for filtering onto glass fiber filters (GFF) filters and grinding of the filters. This step may not be necessary in some systems and tests should be run to compare extractions with and without grinding. Non-grinding techniques can use either GFF or membrane filters that will dissolve in the solvent.
Q: What environmental factors interfere with in vivo chlorophyll analysis?
A: Light, temperature, water quality, and dissolved components can all have significant effects on fluorescent readings independent of the chlorophyll concentration. However, all of these factors can be controlled and/or corrected to a degree if the user is aware of their effects.
Temperature has an inverse relationship with fluorescence. For example, in a vertical profile, as the temperature decreases, the fluorescence will increase independent of chlorophyll concentration. The in vivo chlorophyll fluorescence response changes at a rate of 1.4% per °C. A temperature drop of 10 °C in a vertical profile would result in a 14% overestimation of chlorophyll at the coldest point. Turner Designs' field and submersible instruments have the capability to automatically compensate for temperature effects.
Light history can have significant affects on the fluorescence in algal cells. For example, at low light levels, algal cells can optimize the light uptake by pushing chloroplasts to the outer edge of the cell or by producing more chlorophyll per cell. Both of these responses can result in data increases the fluorescence signal while the algal biomass may be unchanged. To lessen the effects, opaque hose should always be used when sampling natural waters with a field fluorometer. The transport time of the water in the hose will dark-adapt cells to an extent, significantly reducing fluorescence error caused by variations in the light history of the cells.
Dissolved organic matter (DOM), chlorophyll degradation products (pheophytins), chlorophyll b & c and turbidity can also falsely increase the chlorophyll a fluorescence signal. If the dissolved interfering compounds are suspected to be significant, it is worth conducting a quick study to look at the effects by comparing the fluorescence from filtered and non-filtered water samples or from noting the fluorescence signal below the photic zone and using this value as a blank.
Q: What is the effect of varying species on fluorometric chlorophyll analysis?
A: Different species of phytoplankton have varied morphologies (cell packaging), physiological states, size, and chlorophyll a : carbon ratios. All of these factors can affect the fluorescence emitted from a cell under a specific excitation light intensity. Luckily, in natural environments, the phytoplankton assemblage is diverse enough that much of the variation in fluorescence resulting from the factors above balance eachother out so the net effect on the fluorescence reading is reduced. Nevertheless, the researcher needs to be aware of the potential for error in readings caused by these factors to better interpret in vivo data.
 Q: How does other chlorophylls and degradation products affect extracted chlorophyll analysis?
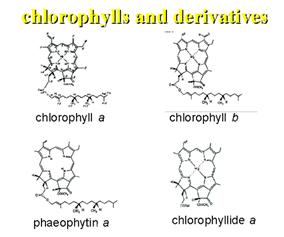
A: All chlorophyll pigments and their degradation products (pheophytins) have their own unique excitation and emission spectra. Unfortunately, these spectra overlap significantly with the fluorescence spectra of chlorophyll a due to the similar chemical structure (see Figure 2). Due to the overlap in fluorescence spectra, the presence of one can result in an interference in the measurement of another, resulting in an under or overestimation of the pigment in question.
In the case of chlorophyll a, interfering pigments to be aware of are chlorophyll b, chlorophyll c, and pheophytina(see figure 3). Chlorophyll b causes the most interference in freshwater systems with high concentrations of chlorophytes and/or prasinophytes and in marine systems with high concentrations of prochlorophytes. In chlorophyll extraction, the interference results during the acidification step of the traditional extraction technique. Chlorophyll b undergoes a wavelength shift when acidified, resulting in an underestimation of chlorophylla and an overestimation of pheophytin. In environments with high chlorophyll b concentrations, we strongly recommend using the Welschmeyer (non-acidification) method.
High concentrations of chlorophyll c can result in a slight overestimation of chlorophyll a and an underestimation of pheophytin a sometimes even resulting in negative pheophytin readings. It has been reported that a chla :chlb ratio of 1 : 1 , which is the highest ratio which could occur in nature, would result in achla overestimation of 10%.
High concentrations of any of the interfering compounds will result in an increase to in vivo chlorophyll readings. The magnitude of the increase will depend on the instrumentation used. Instruments using filters with a wider bandpass will be more effected by interfering compounds than instrument with narrower bandpass filters.
Q: What is a secondary standard?
A: A secondary standard is used as an alternative to a primary calibration standard. It is often used when primary standards are expensive, difficult to obtain, or unstable. In the case of chlorophyll a, a secondary standard can be used the majority of time for calibration because liquid chlorophyll a standards are expensive, time-consuming, and photosensitive. To properly use a secondary standard, you must first calibrate with a primary liquid standard of the fluorophore of interest. You can then obtain the equivalent value of the secondary standard. Henceforth, you may calibrate using the secondary standard using the value you obtained for it initially. An occasional calibration using a primary standard to recheck the stability is recommended.
In the past, secondary standards have been more stable than the primary standards they mimic, but have still required special storage and handling conditions with relatively short lifetimes. Examples of these include coproporphrin and fluorescent dyes such as Rhodamine WT.
Turner Designs has developed a solid secondary standard that is stable under ambient light and temperatures with no special treatment or storage required. This new secondary standard will greatly reduce time, cost, and trouble in fluorescent chlorophyll analysis procedure.
Q: What is the best solvent and procedure for the extraction of chlorophyll a?
A: The most commonly used extraction solvent is a 90% acetone 10% DI water solution. Other solvents, such as methanol, ethanol and acetone/DMSO mixtures are also commonly used and can improve extraction efficiency with specific phytoplankton or may be found useful for the extraction of sediment samples.
There is no 'best' solvent or procedure for chlorophyll extraction. Several work well and have their own pros and cons. The E.P.A. Method 445.0 describes the recommended step-by-step process for analysis using 90% acetone. There are many factors in the extraction process that can lead to different results. Several examples of these factors will be discussed below in hopes reducing some of the variability.
An excellent resource for sample collection, storage and extraction methods is the UNESCO publication, Phytoplankton Pigments in Oceanography.
Water collection, storage, and filtration:
Because pigment is being extracted from living cells, it is critical to use consistent techniques of obtaining water, filtering and storing filters. The living cell is sensitive to changes in the environment such as temperature and light. Conditions leading to cell death or damage will affect chlorophyll concentrations.
In the collection of water samples, it is important to make certain that the collection containers are clean of all chemicals. They should be rinsed several times in the sample water. Once collected, if samples cannot be filtered immediately, they should be stored quickly on ice in the dark. The time between collection and filtration should be as brief as possible and should not exceed 4 hrs.
Specifics on the recommended filtration and storage procedure can be found in E.P.A. Method 445.0. An excellent resource for sample collection, storage and extraction methods is the UNESCO publication, Phytoplankton Pigments in Oceanography.
Q: How do I take and store discrete water samples in the field?
A: For discrete in vivo analysis, water samples should be measured as soon as possible after collection. The same time constraints should be placed on the filtering of water samples that are to be used for extracted analysis. From the time of collection to measurement, the samples should be stored in the dark on ice. Remember that the cells are living and significant time in a container will alter the physiological state of the algal cells, resulting in misrepresented chlorophyll data compared to the natural situation.
Discrete samples need to be kept at the same temperature. This is most easily accomplished through the use of a water bath. The bath should be covered from direct light. When the samples are being measured in the fluorometer, a 'time in the instrument' must be established. Use the discrete sample averaging function on the 10-AU or TD-700 Fluorometer or wait for the reading to stabilize (~10 seconds) and record the fluorescence. If this time is not monitored the heat and light in the instrument will cause fluorescence to change.
When developing you own sample collection and storage procedures, it is recommended to run your own experiment to test change in fluorescence over a given transport time by analyzing samples from a given sample at hour or half-hour intervals.
Q: How do I calculate actual chlorophyll a concentrations from my fluorometric data?
A: ACIDIFICATION METHOD
Prior to running sample on the fluorometer, the instrument must be calibrated with a pure chlorophyll a standard and the maximum acid ratio must be determined by measuring the fluorescence of the standard before and after acidification. If afluorometer other than a digital Turner Designs instrument is being used, the fluorometer sensitivity coefficient may also need to be determined. For further information please refer to EPA Method 445.0.
chl a =K (Fm/ Fm -1) x (Fb-Fa) x (v/V)
pheo a =K (Fm/ Fm -1) x [(Fm x Fa - Fb)] x (v/V)
If necessary, the result can be multiplied by a dilution factor.
where:
K= sensitivity coefficient, equal to 1 on 10-AU
Fm = max acid ratio Fb/Fa of pure chlorophyll a standard
Fb = fluorescence before acidification
Fa = fluorescence after acidification
Fo = fluorescence signal of sample
v = extract volume (L)
V= volume filtered (L)
NON-ACIDIFICATION METHOD (Chlorophylla concentration only)
1) Collect fluorescence data (one number/sample)
** DO NOT ACIDIFY**
2) Plug data into following equation:
chl a = (Fo x v)/ V
where:
Fo = fluorescence signal of sample
v = extract volume (L)
V= volume filtered (L)
Q: Does the E.P.A. approve fluorometric chlorophyll analysis?
A: Yes, the E.P.A. has published Method 445.0 which covers the in vitro(extraction) fluorometric analysis of chlorophyll a. In the most recent revision (Rev 1.2 Sept., 1997), the E.P.A. also approves the use of the non -acidification method, which is less susceptible to interfering compounds such as chlorophyll b. This filter kit supplies only chlorophyll a concentrations with no information on pheophytin concentration.
Q: How can I compare chlorophyll data obtained through different measurement techniques?
A:All detection instrumentation used in chlorophyll analysis will result in chlorophyll concentrations that are directly comparable. A side-by-side comparison between a fluorometer and a spectrophotometer is easily done but would require dilution of the chlorophyll sample to put it within the linear range of the fluorometer. A sample that is in range on a spectrophotometer will be over-range on a fluorometer.
Q: Why use a fluorometer over a spectrophotometer for extracted chlorophyll analysis?
A: Benefits of fluorescence over spectrophotometry include the capability of in vivo detection, sensitivity, durability, versatility (accepts a wide range of discrete sample cells and flow cells, accepts AC or DC power, and the user can choose and quickly change between many optical kits), ease of use, stability, ease of transport, and a small footprint.
For oceanographic research, the greater sensitivity of fluorescence results in less time and work in the analysis because much less water must be filtered for extracted analysis. The superior sensitivity also enables in vivo detection of chlorophyll concentration of <1µg/L.
Freshwater researchers now have an extremely accurate and easy way to measure chlorophyll a even with high chlorophyll b concentrations using the non-acidification optical kit. Fluorometers also allow for in-line monitoring to collect data in real time.
Q: What are the chlorophyll detection limits of Turner Designs Fluorometers?
A: The TD-700 Laboratory Fluorometer and the 10-AU Field Fluorometer with a red sensitive photomultiplier tube (PMT), have extracted chlorophyll detection limits of 0.02µg/L using a 13mm diameter test tube and 0.01µg/L using a 25mm test tube. The SCUFA® Submersible Fluorometer can detect in vivo chlorophyll concentrations to 0.02µg/L.
Most necessities are provided by the ship but a few amenities can make the cruise more comfortable:
| Sea sickness medication: | If you know you are prone to seasickness, bring any medication you know works for you. Marezine, Meclizine, Bonine, Dramamine or Scopolamine anti-seasick medications are some examples – some work for some people; some have side effects; some dosages require a prescription. The ship can provide over-the-counter remedies but we suggest consulting your doctor or pharmacist & bringing your own. Summer and fall cruises are typically calm but the weather can get rough any time of year. |
| Clothes you can layer: | It is better to wear multiple layers than wear a heavy jacket since you will be moving in and out of the climate-controlled lab. Even summer cruises can be cool (even cold) so always bring long pants, a windbreaker, sweater or sweatshirt, and a beanie. |
| Boots: | Calf high rubber boots are a must-have. The work area is usually swamped by seawater so your shoes will constantly be wet. Comfortable, waterproof boots are a necessity since you will be sampling from the CTD or washing nets. The more comfortable the better but even cheap ones are better than wet tennies. We have a limited supply of 'loaners' sizes available upon request. |
Seawater Sampling
- All sample bottles are rinsed three times before the final fill.
-
The sample bottle number always matches the rosette bottle number on full (20+ bottles closed) stations. On shallow stations, salinity samples may be drawn into an existing case. The watchleader will manage the sample log & bottle numbering in these situations & inform sample drawers.
- If you have any doubt about the sample’s integrity, dump & redraw it. There is plenty of seawater from each depth.
- More than one person can draw a sample type but be sure to keep the order straight, returning your bottle or tube to the right spot, right order. If you need to step away from sampling for any reason, be sure to return an unfilled sample bottle to the right slot & inverted.
Watchstanding
-
Notify your watchleader if you have to “disappear” for more than a few minutes especially if you are too seasick to work. Seasick medication is available so ask if you are feeling ill.
- Be available to help with CTD preps 20mins before the station ETA (estimated time of arrival). Station ETA is displayed on the navigation monitor in the ship’s main lab. Occasionally, when navigating around islands or coastline, the ETA displayed may be a “waypoint”. These are turning points, not the actual station arrival time. Check with the watchleader if uncertain.
- If you will be unavailable to help prep the CTD because of other duties or illness, let the watchleader know. You are expected to be available to help when you are on watch and the watchleader should not have to go looking for you.
- Check with the watchleader before leaving for meals; the CTD cast usually takes 45-50mins but shallow stations may be much shorter so don’t leave until checking with him/her.
- Watches are 12 hours: 0000-1200 and 1200-0000. Be sure to get enough sleep especially if you are on midnight (0000-1200) watch – it may take a few days to adjust to this watch.
CalCOFI Data Report Data Description:
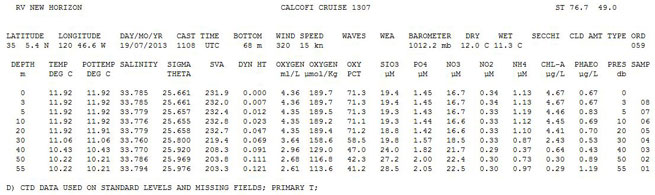
Line 1, Field 1: Research Vessel
Line 1, Field 2: Cruise Name
Line 1, Field 3: CalCOFI Line & Station (CalCOFI's standard line and station values)
Line 3, Field 1 - 2: Latitude and Longitude of station at beginning of CTD upcast
Line 3, Field 3 - 5: Cast Date & Time (UTC)
Line 3, Field 6: Corrected echo sounder bottom depth
Line 3, Field 7 - 8: Wind direction (360 degrees) & speed (kn) (WMO Codes 0877)
Line 3, Field 9 - 11: Wave direction (360 degrees), height (m), period (s) (WMO Codes 0885)
Line 3: Field 12: Weather code (WMO Code 4501 table)
Line 3, Field 13: Barometer (mb)
Line 3, Field 14 - 15: Dry and Wet bulb air temperatures (to derive relative humidity)
Line 3, Field 16: Secchi depth
Line 3, Field 17: Cloud Amount (WMO Code 2700)
Line 3, Field 18: Cloud Type (WMO Code 0500)
Data Records:
Depth (m)
Temperature (deg C)
Potential Temperature (deg C)
Salinity
Sigma Theta (density anomaly calculated with the potential temperature, salinity, and at 0 decibars pressure)
SVA - specific volume anomaly
Dyn Ht - dynamic height
Oxygen (ml/L)
Oxy Pct - Oxygen Saturation
SIO3 (uM/L) - Nutrient concentration Silicate
PO4 (uM/L) - Nutrient concentration Phosphate
NO3 (uM/L) - Nutrient concentration Nitrate
NO2 (uM/L) - Nutrient concentration Nitrite
NH4 (uM/L) - Nutrient concentration Ammonia
Chl-a (ug/L) - Chlorophyll-a concentration
Phaeo (ug/L) - Phaeopigment concentration
Pres (db) - Pressure in decibars
Samp - Cast+bottle number
Notes: ISL stands for interpolated standard level; CSL stands for CTD standard level data; D footnote denotes CTD data used instead of bottle data; U denotes uncertain values. Please refer to the data report bibliography for definitions/algorithms.
Comments: The specific volume anomaly is essentially the reciprocal of density, with the standard ocean (T=0, S=35) subtracted out, times ten to the fifth (therefore SVA=330 is really .00330). It is used to figure out how much higher or lower a column of water is relative to some common deep reference level (the dynamic height). SVA is integrated from a depth or pressure to some other depth or pressure to get the dynamic height between those depths. For example, if we integrate from 500 m to the surface and get 1.234 dynamic meters, that means that the ocean is about 1.234 meters taller than a standard ocean would be if it were all at 0 T and 35 S (if we divide by .98 (G) to get true length). The dynamic height is used to calculate the sea surface slope between stations to determine the relative (relative to the chosen reference level) geostrophic currents. A contoured field of dynamic height shows the location of eddys and direction of the currents, as well as the relative strength of the currents (the steeper the gradient, the faster the current).
The dynamic height can be negative if the water is colder than 0 degC, such as in the Norwegian Sea in winter, or if the salinity is much higher than 35, such as in the Mediterranean or Red Sea.
The sense of flow can be determined by imagining that you are standing on the high dynamic height side of the current, looking downhill the current is toward the right in the northern hemisphere. It would be in the opposite direction in the southern hemisphere. (Descriptions courtesy of Arnold Mantyla, Sep 10 2002)
|
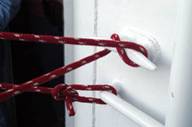
One of the first things taught to new cruise participants is line handling – lines are attached to the CTD-rosette to stabilize it during deployment and recovery. Rough weather & a rolling ship can cause the 800lbs (empty; 363kg) -1500lbs (full; 680kg) CTD-rosette to swing dangerously when the winch lifts it. Taglines allow the CTD-rosette to be deployed safely during these conditions. Tagline training is introduced under calm conditions so participants are prepared if rough weather occurs. Important things to remember: |
|
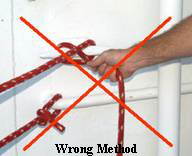
| 1. Wrap the line around the cleat, careful not to bind on itself when the CTD moves up or down, in or outboard. |
 |
| 2. Keep your hands at least 12 inches (30cm) from the cleat as the line slips out. |
 |
 |
|
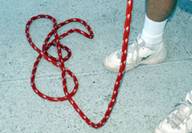
| 3. Be sure to watch for line tangles and do not stand inside a loop. If you see ANY line or wire becoming entangled, be sure to shout out "STOP" to bring attention to the problem. |
 |
|
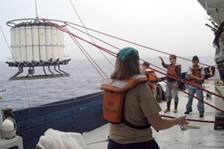
4. Always keep your line tight by pulling out the slack but do not inhibit the CTD’s movement on or off the ship. A good indicator is the angle of the winch wire – if it is angled towards your cleat then it may be too tight. When the ship rolls, quickly take up the slack to prevent the CTD from swinging but let line out as the tension increases. Angling the CTD slightly inboard is acceptable when bringing the CTD-rosette back aboard. Never put yourself between the CTD and an immovable object such as a wall or rail. Watch your toes when the CTD lands – 1500lbs will crush them. Wearing steel-toed boots or shoes is recommended. |
 |
| 5. The CTD must be secured to the deck or cleat by line or tagline when onboard. The CTD should not be untied from the deck-eyes unless cleated by the taglines. Loop the line around the cleat then under itself when waiting to deploy or while securing the CTD to the deck eyes. |
 |
Historically, when designing the original CalCOFI Line.Stations pattern, the transect lines were plotted perpendicular to the coastline with .0 decimal accuracy. Since reporting lines and stations with decimal accuracy was unnessary at the time, line and station numbers were rounded to whole numbers to save data column space. Computer cards had a limited number of character columns such as 128 columns in 1983 when the IEH ascii format was adopted. Data storage was also limited.
With the addition of 9 SCCOOS stations in 2004, it became necessary to report the Line & Sta numbers with .0 decimal accuracy to resolve stations. For example, to resolve sta 93.3 26.7 from SCCOOS sta 93.4 26.4, we have to report the decimal line.sta numbers in all the data. Since SCCOOS station data have been integrated into the CalCOFI time series, decimal line & station numbering was applied to the entire time series, even before 2004. Lines & stations of older data on ERDDAP or other biological datasets may not be reported to .0.
Line Number Reporting (Pre-2004 = Current): 93 = 93.3, 90 = 90.0, 87 = 86.7, 83 = 83.3, 80 = 80.0, 77 = 76.7, 73 = 73.3, 70 = 70.0, 67 = 66.7, 63 = 63.3, 60 = 60.0
And between line stations like Santa Barbara Basin: 82.47 = 81.8 46.9. So station designation has changed from 90.120 to 90.0 120.0, 93.27 to 93.3 26.7. It should be noted that the Line.sta calculator & algorithm will derive decimal, not integer, line & station numbers from latitude and longitude.
Differences in CalCOFI Line.Sta numbering in the CalCOFI time-series have been discussed especially when relating historical net tow data to hydrographic data.
When comparing time-series datasets, there are times when there are no matches between biological (zooplankton, ichthyoplankton) and physical (temperature, salinity, oxygen) data. Some data may not have matches, but other data may not match because the criteria used miss data, such as CalCOFI Line and Station numbers reported as integer vs decimal..
Here are some CalCOFI practices that may cause data to not match:
- early (1950's) CalCOFI net tows were often done between stations ie nets were tow as the boat transited between stations. So using specific latitude-longitude or CalCOFI Line.Sta as criteria may not match data.
- there are often net tows but no hydro (bottle or CTD) cast & vice versa. On some early cruises, only one 10m bottle was collected on station. On cruises such as in 1979, net tows were done but no bottle casts. NOAA fisheries performs other surveys in the CalCOFI area where net tows are performed, samples collected, & data added to their dataset without matching physical data. CalCOFI cruise reference: http://calcofi.com/field-work/station-info/20-survey-coverage.html
- If the ocean conditions are bad, station operations may only include a bottle or CTD cast and no net tows or vice-versa.
- During the 70's CalCOFI cruises were every three years so there are gaps in the time-series.
Finding criteria to match data should be easier from 1983 to present since cruise & data practices were improved.
To improve matching biological to physical data, especially when including data earlier than 1983, it is recommended to use criteria ranges instead of exact numbers when possible. Date-time windows of 2-4 hours or lat-lon ranges that are within ~2nm of each other. Two nautical miles is still CalCOFI's "on-station" criteria.
One option that may improve data matches in older data is to use Rpt_Line & Rpt_Sta in the hydrographic dataset for CalCOFI Line & Station since these may be rounded.
Another option is to exclude SCCOOS station data when querying rounded (to integer) CalCOFI Line & Station data.
- After completion of the net tow, concentrate the plankton sample into the cod end by washing down the net with the deck seawater hose (DO NOT use fresh water). Be sure to spray the net from the outside to minimize damage of the delicate plankton in the sample.
- Once the sample is concentrated into the cod end, use a screwdriver to loosen the hose clamp. Give the cod end a tug to detach it from the PVC coupler. If the sample will overflow the cod-end when removing it from the coupler, grab a bucket and remove the sample over the bucket. Make sure to wash down any sample remaining in the net into the bucket as all our plankton tows are quantitative (no sample can be lost).
- Take the cod end into the preservation sink area. Remove the appropriate jar from the sample box (pint jar for Pairovet and Manta, quart jar for Bongo; all boxes are labeled accordingly) and set it into the sink rack. Be sure the begin-tow time is written on both inside & outside labels, using pencil for inside and Sharpie for outside. Peel off the outside label backing and stick to jar lid. Put the inside label into jar.
- Using the filtered seawater hose, concentrate the plankton into the bottom of the cod end. It is ok to gently spray the inside of the cod end at this point but not so hard you will damage the organisms. Once the plankton are sufficiently concentrated towards the bottom, invert the cod end into the draining sock (a wooden dowel helps). There are 2 different mesh sizes of draining sock, always make sure you use the appropriate size mesh for the sample you are preserving (.150 for Pairovet samples, .333 for Manta or Bongo). The draining sock is helpful because it allows you to use as much seawater as necessary to thoroughly rinse the cod end. Gently spray the cod end with enough seawater to remove all the plankton clinging to it. It is very important not to lose any part of the sample or it will no longer be quantitative. Large pieces of kelp or grass or anything obviously not plankton can be rinsed off thoroughly and discarded at this point. Using a spoon, transfer the plankton into the jar. Rinse the spoon into the draining sock and then invert the draining sock into the jar. Wash down any of the remaining plankton into the jar with the rest of the sample, filling the jar with seawater to just below the shoulder.
- Wear eye protection. Add a squirt of supersaturated sodium borate to the sample for buffering purposes. Formalin is slightly acidic so the borate raises the pH of the sample to neutral. Add 10 cc. to pint jars, 20 cc. to quart jars. The syringe is usually marked with a “P” for Pint and a “Q” for Quart.
- To add full strength formalin, unclip the plastic binder attached to the tygon tubing of the formalin rig to allow for flow. Hold the 60 cc. syringe firmly and pull out the stopper to the desired amount (25 cc. for Pint and 50 cc. for Quart). Re-clip the plastic binder and dispense the formalin into the jar. Be careful not to spill any or push so hard the formalin squirts out the back of the syringe. Formalin is very caustic and extra care should be taken when dispensing it. If you have any allergies to formalin then you should not help with this step of the preservation process.
- After the formalin is added, secure the lid tightly and invert the jar a few times to ensure proper mixing of sample & chemicals. Return the sample jar back to the correctly labeled box.
- Rinse the cod end with the deck seawater hose and invert it back to the original position. Reattach the cod end to the coupler and tighten the hose clamp securely.
Thank you for all your help, it’s greatly appreciated !!
SIO-CalCOFI data file casts.csv is the main hydrographic station information data file used by our data-processing software.
Tasks normally performed by watchstanders & volunteers after training:
-
CTD prep – draining and rigging of CTD for deployment 20mins before station. Rosette bottles are drained, bottom lanyards unclipped; once drained, all valves are closed and rotated 90°, breathers are closed (lightly finger-tight), & spring-loaded bottles are rigged open so they can be closed at target depths.
- CTD launching and recovery - help untie the deck lines; handle tag lines to keep the package from swinging during deployment; hook the CTD on recovery and help land the CTD safely on deck; tie the CTD back down
-
Sample Drawing – Refer to the electronic sample log screen or ask the watchleader for the bottle numbers to sample. The number of samples and the bottle they start on can vary - shallow stations have fewer bottles; others may have extra bottles with additional samples to draw. But typically the sample bottle number should match the CTD bottle number so double-triple check when drawing samples. Certain sample types may not be drawn from all the bottles. Shallow stations samples may share an oxygen or salt case so sample bottle numbering will not always match the CTD bottle. The watchleader should tell you when the numbers are different.
-
Samples drawn are:
- Oxygens – must be drawn first to minimize contamination, usually by the CTD operator
- DICs - (drawn on ~16 stations only) must be drawn immediately after the oxygens
- Salts – very sensitive to fresh water contamination (ie rain) and evaporation
- Nutrients – very sensitive to phosphates (soap residue on hands) or cigarette smoke (ammonia contamination)
- Chl – samples are volumetric so no bubbles are allowed in the sample bottles
- HPLC – volumetric, filled completely; volume varies with chlorophyll concentration
- Phyto – “Pooh” sample from ~10m; formalin preserved, no rinses; usually taken by the CTD operator
- Prodo – Primary productivity C14 uptake experiment, done at the noon station; samples drawn by the prodo person
-
Samples drawn are:
- All sample containers except the 10m "phyto" (phytoplankton; also called "Pooh") samples require 3 rinses.
Subcategories
CalCOFI Handbook
The CalCOFI Handbook is a compilation of information for cruise participants. It explains many aspects of the science performed at sea, particularly the sample drawing methods for each sample type.
Data Formats
CalCOFI Data File Formats
Methods
CalCOFI standard practices for sample analysis, data processing, metadata & general methodology.
Software
SIO-CalCOFI software used at-sea and ashore, developed by the SIO CalCOFI Technical Group. Plus other software: auto-titrator oxygen analysis software developed by SIO's Ocean Data Facility; Seabird Seasoft & Data Processing software; Microsoft Office, Ultraedit, Ztree, hxD hex editor, Matlab, Surfer, Ocean Data View.