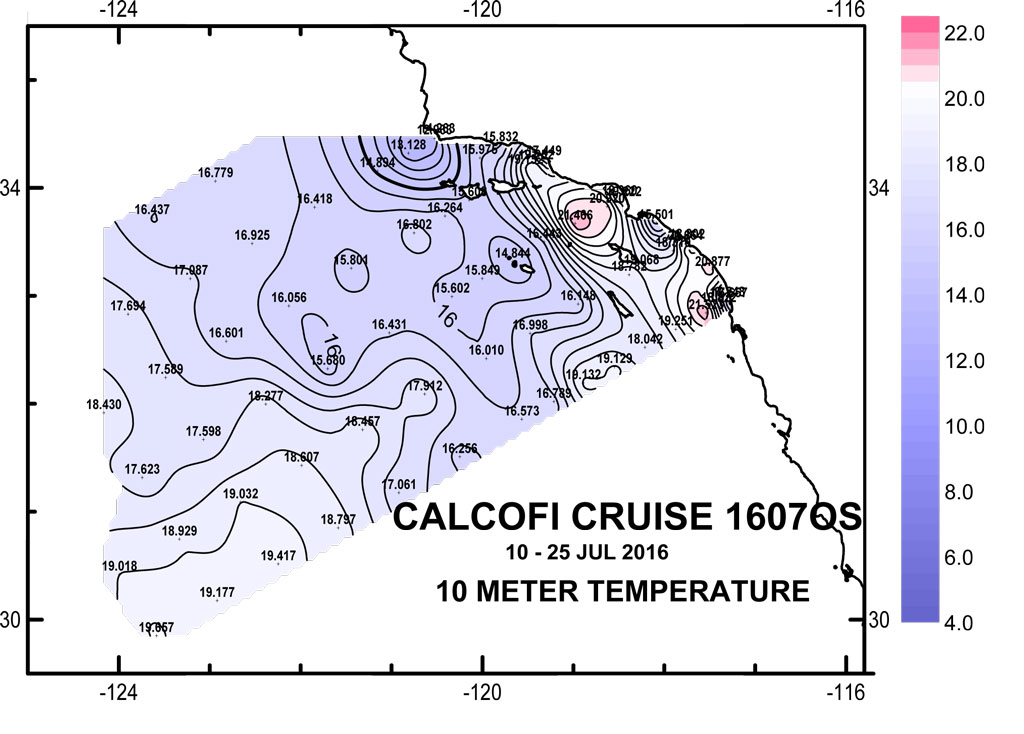
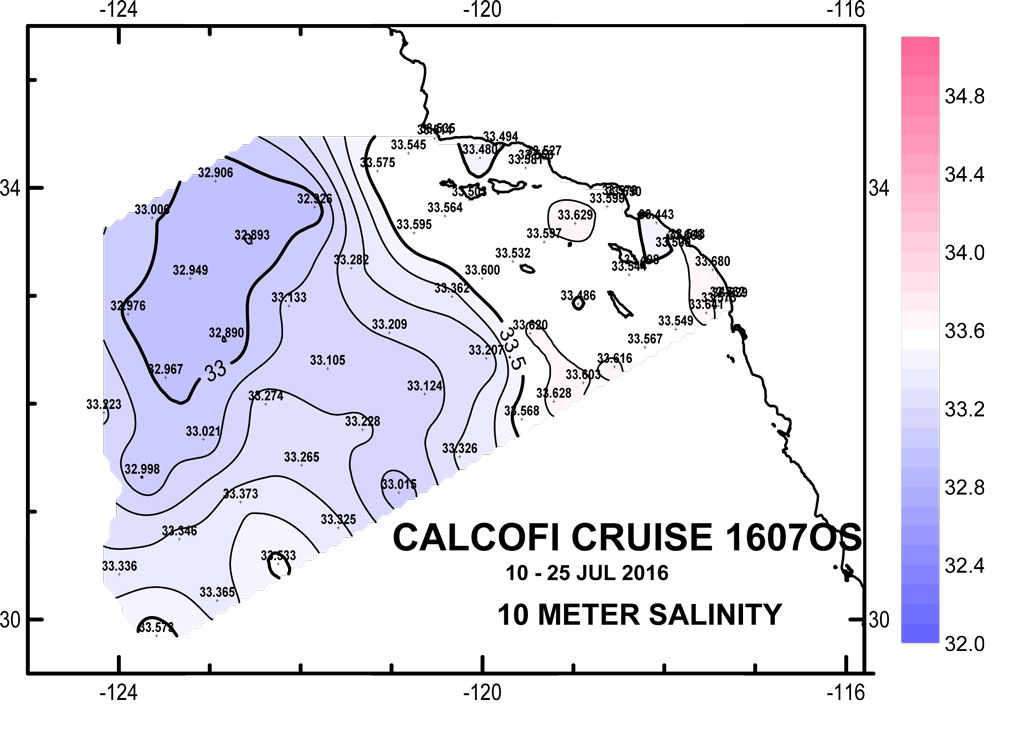
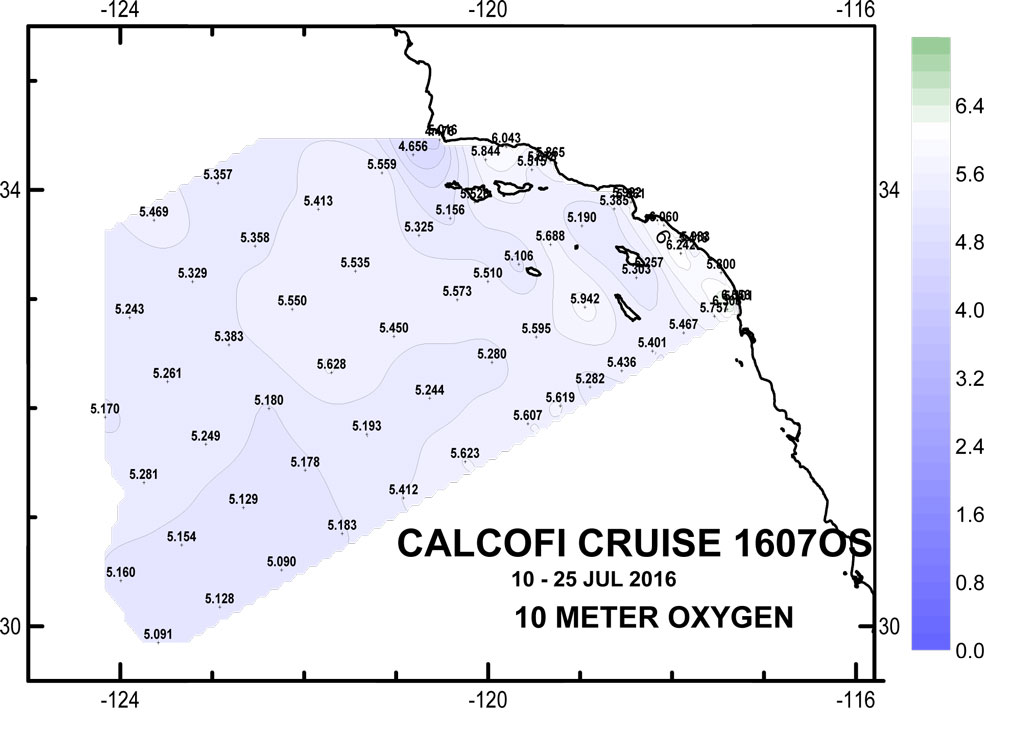
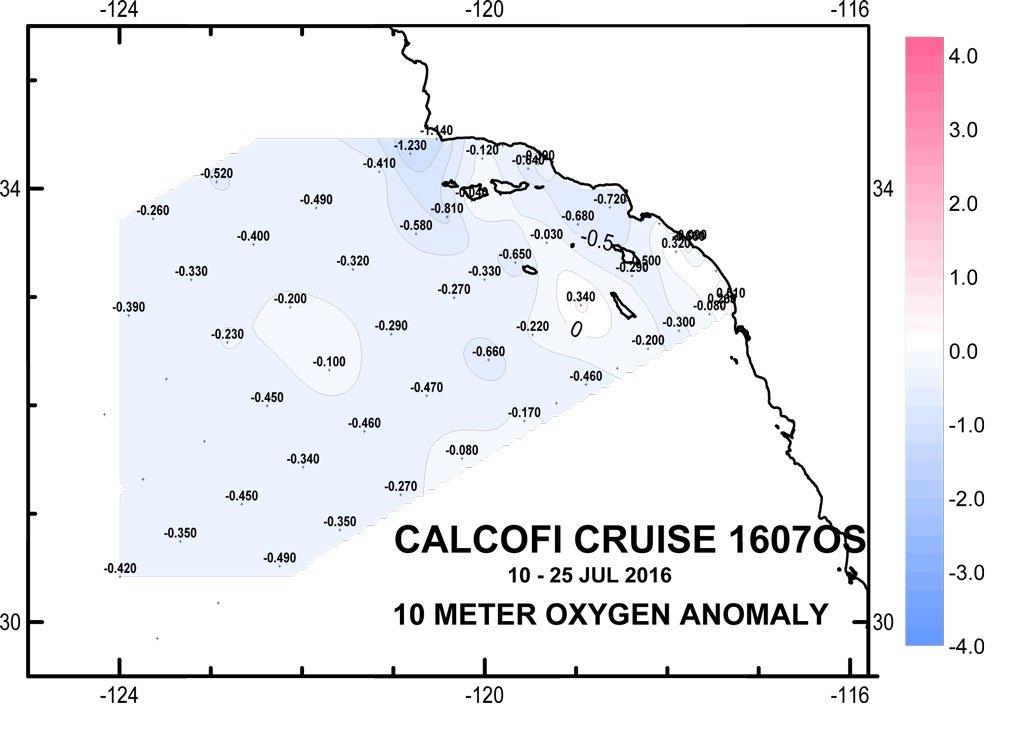
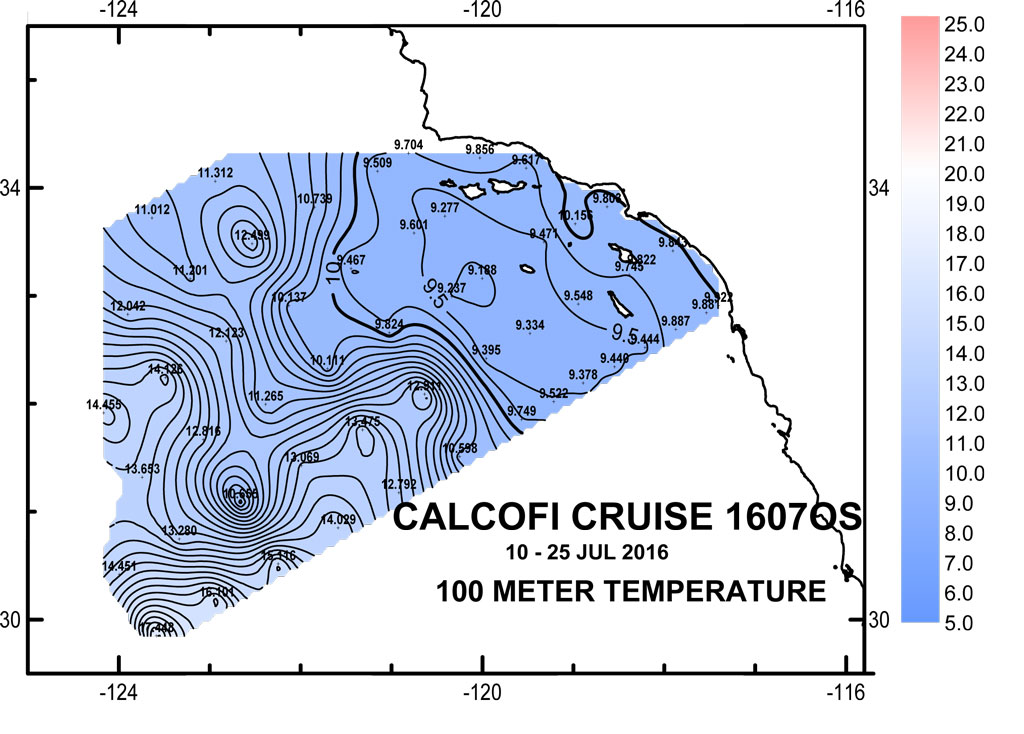
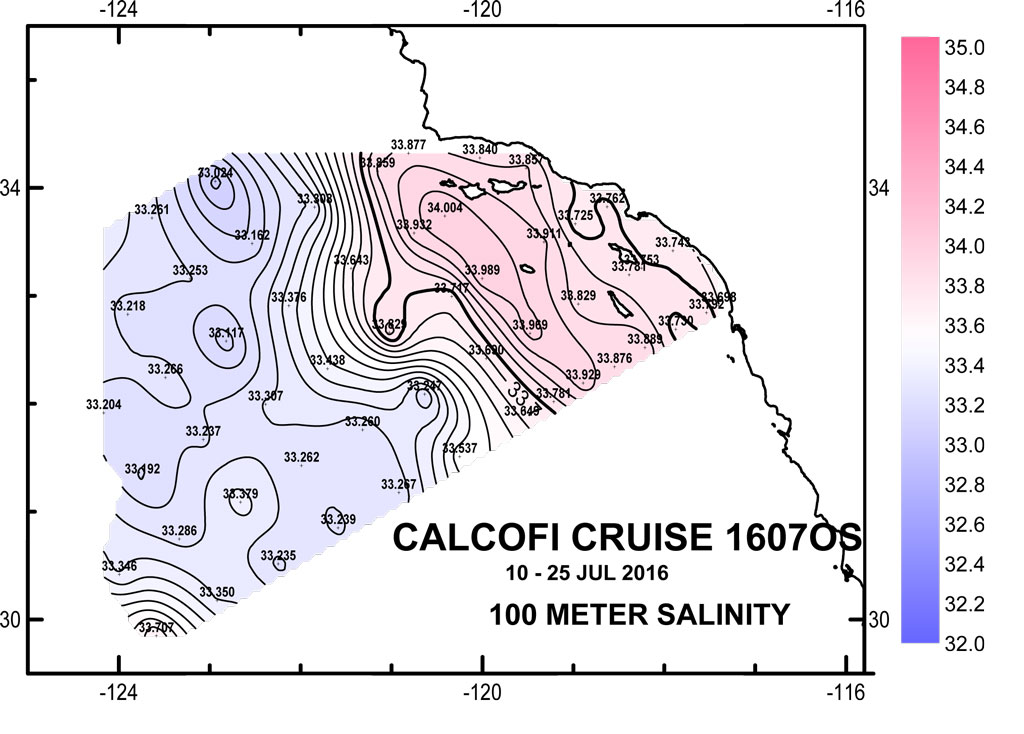
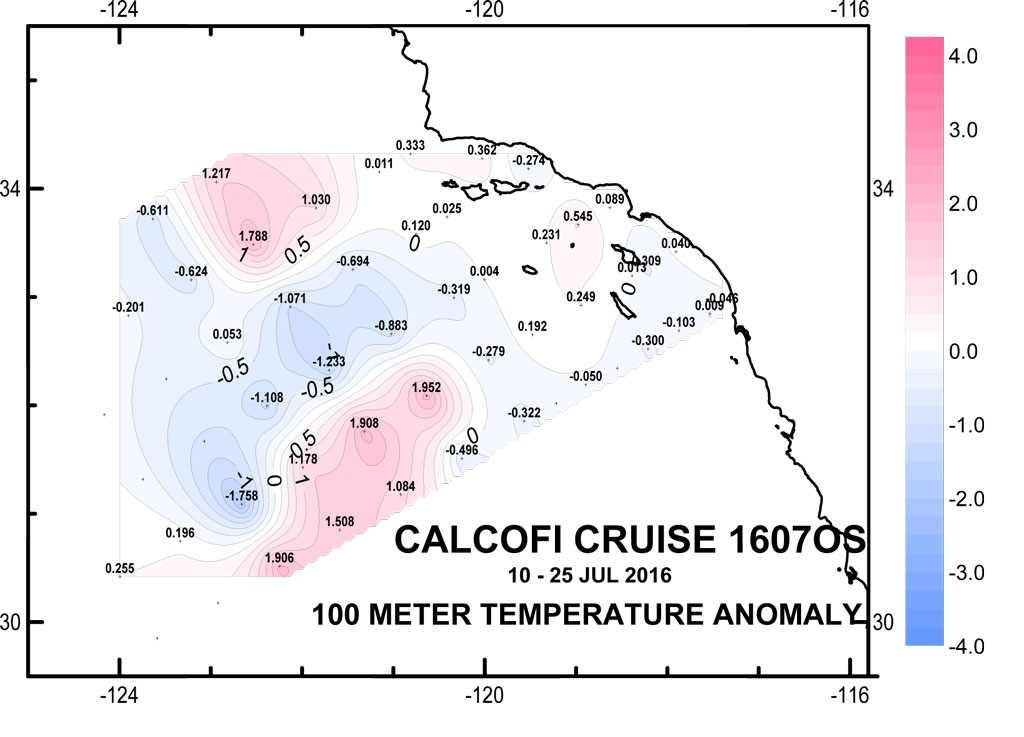
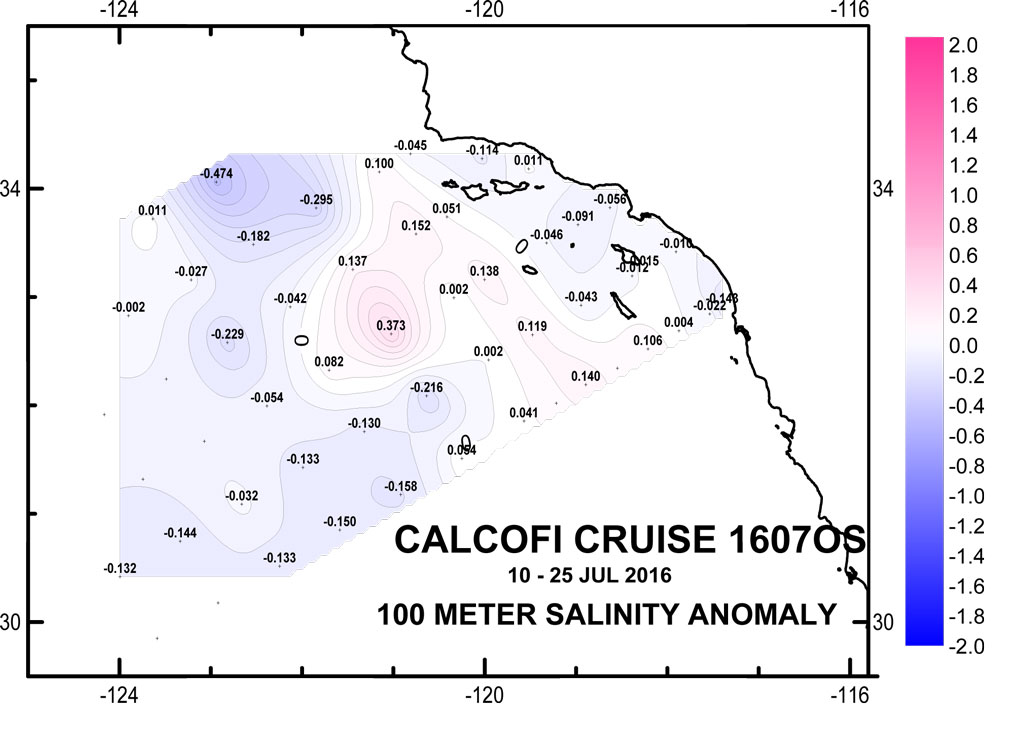
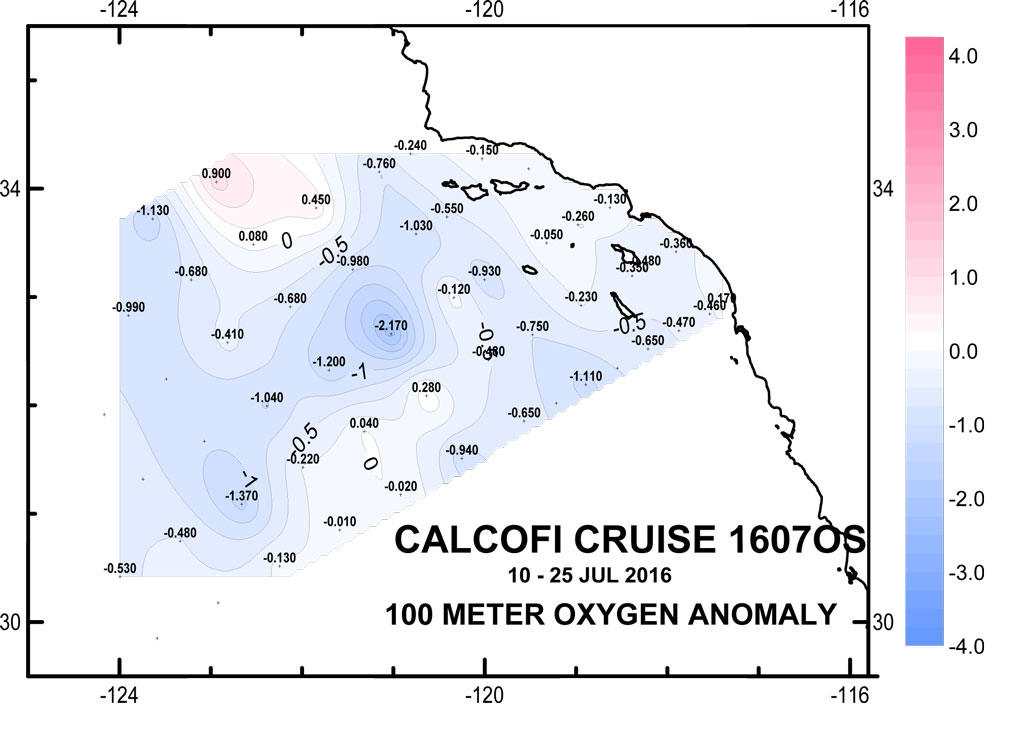
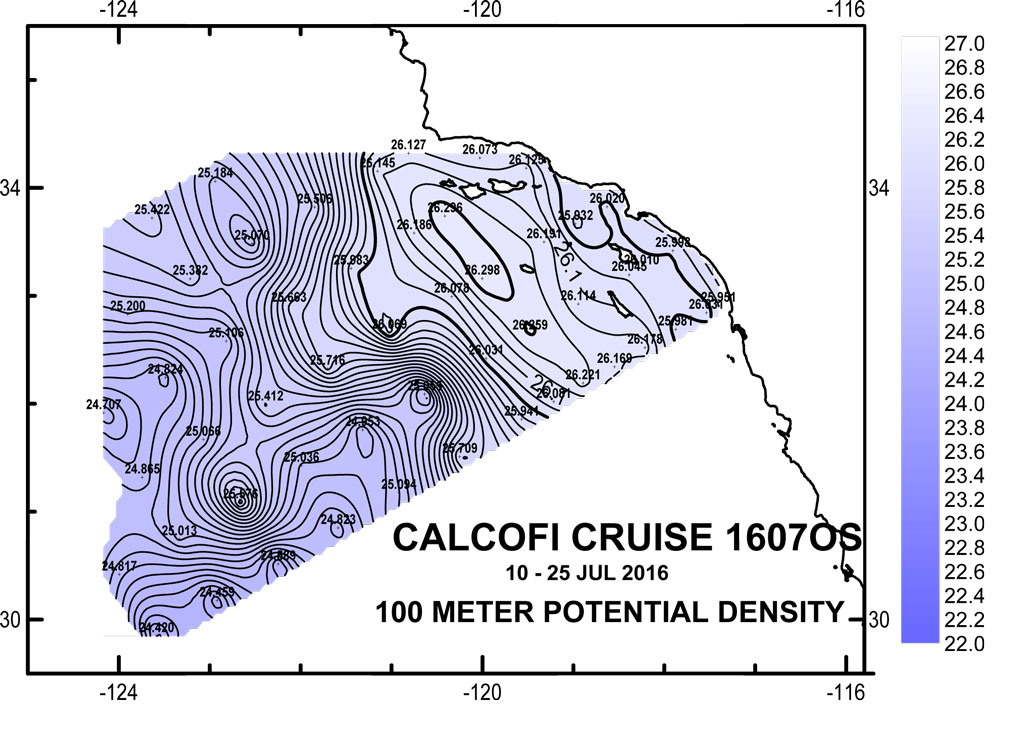
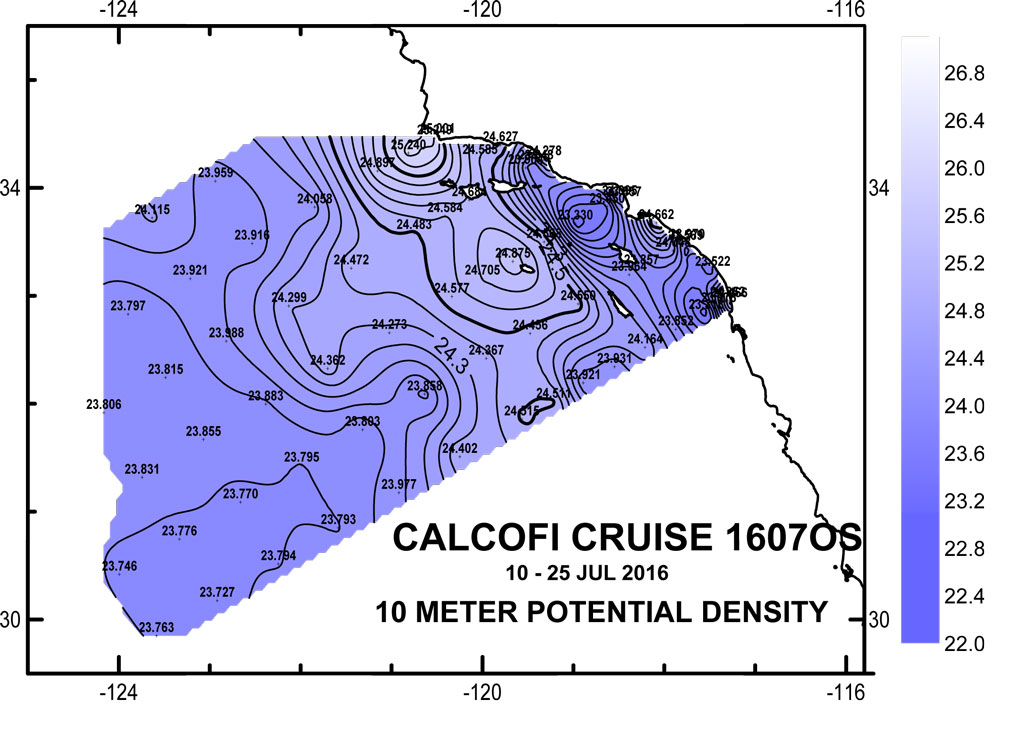
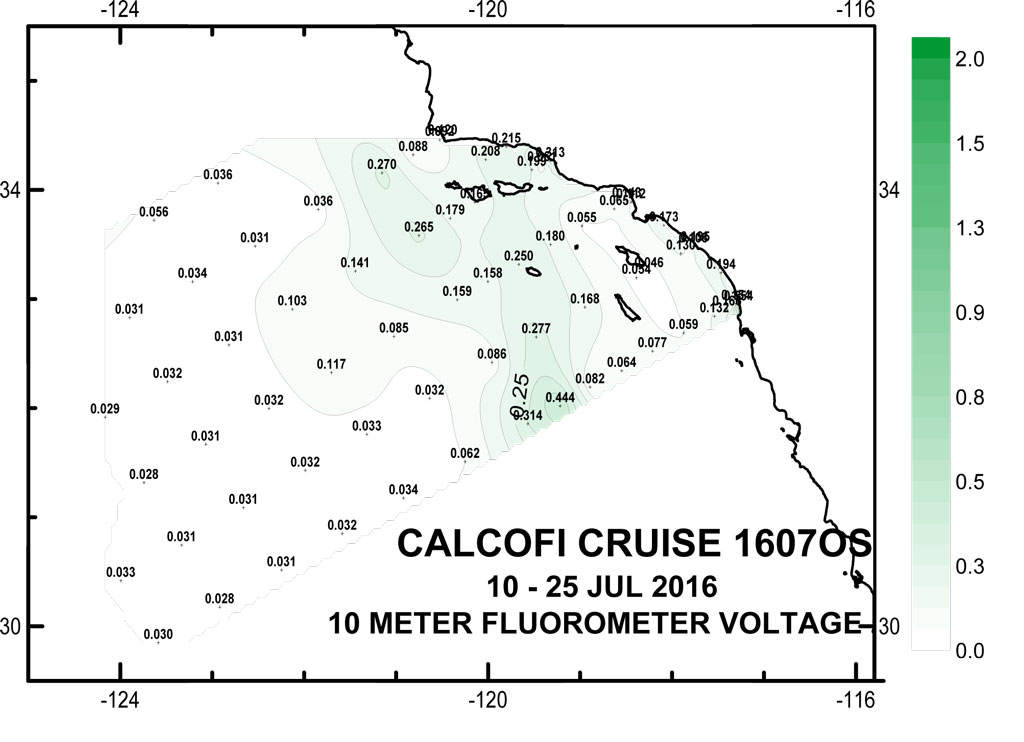
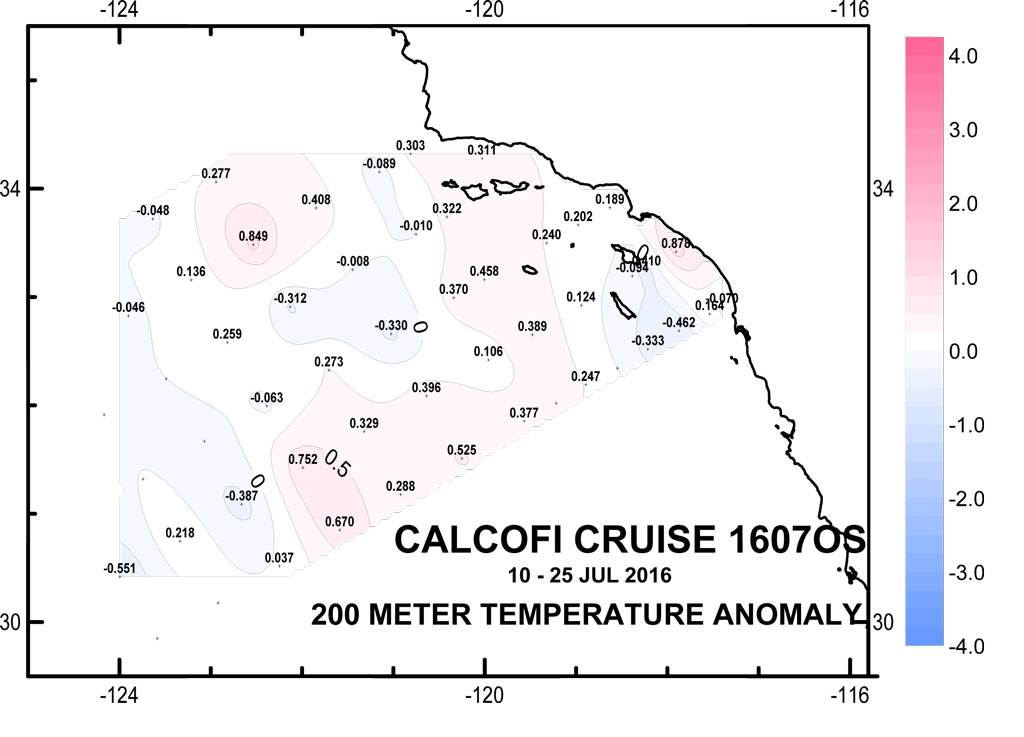
Please note that the anomalies are based on 50-year harmonics (1949-1999) and these data are 1m binavg Seasoft-processed CTD data that have not gone through thorough quality control checks or bottle corrections. They are presented to give a general impression of current conditions. Final data plots will be published after all data are processed. Please note that these plots are missing stations 80.80 & 80.70 due to bad weather. Anomaly data are not available on stations north of line 76.7 since they are typically only occupied on the Winter and Spring cruises, inconsistently.
| 10 & 100 meter Preliminary CTD Data & Anomaly (50yr mean) Contours (Click for larger image) | ||
 |
 |
 |
 |
 |
 |
 |
 |
 |
 |
 |
 |
 |
 |
 |
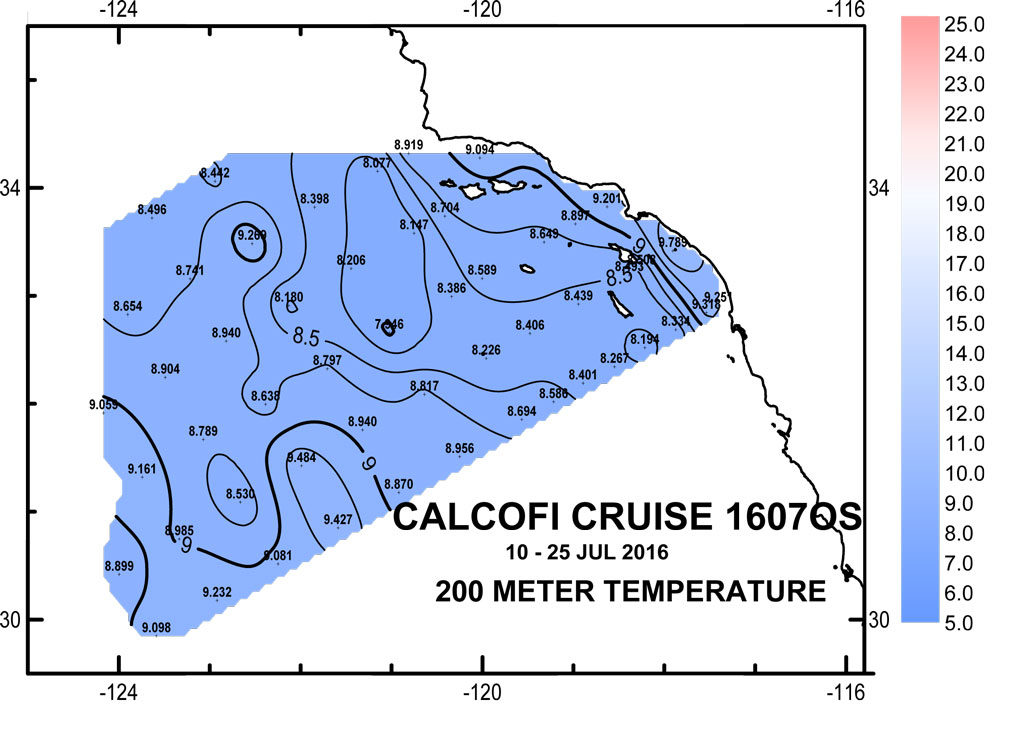
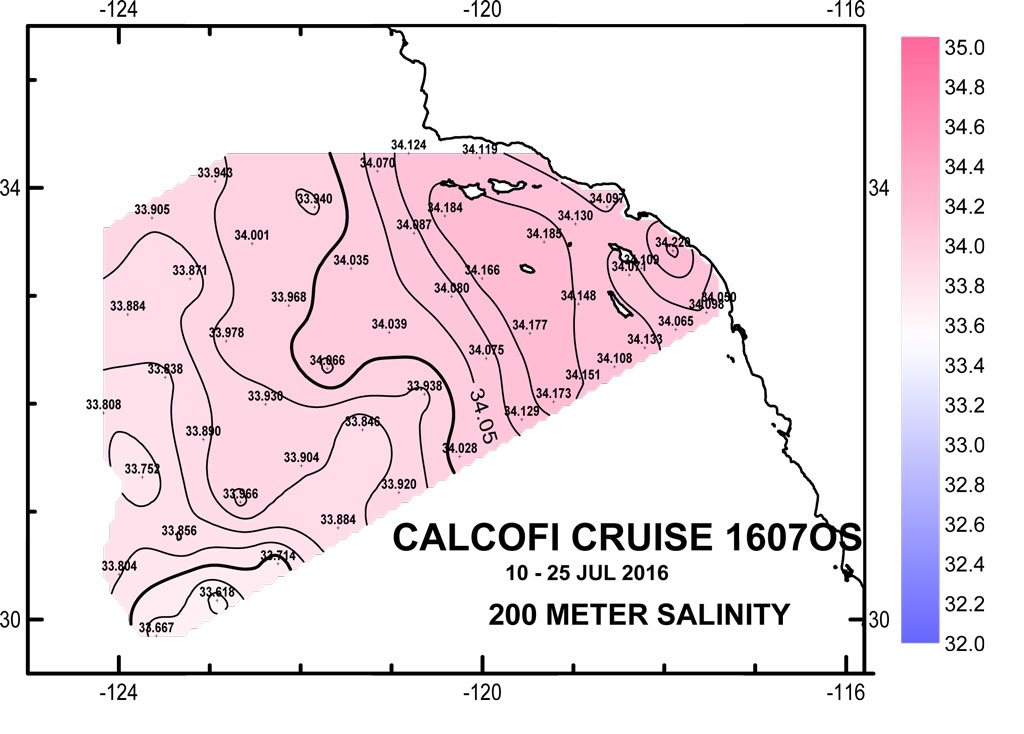
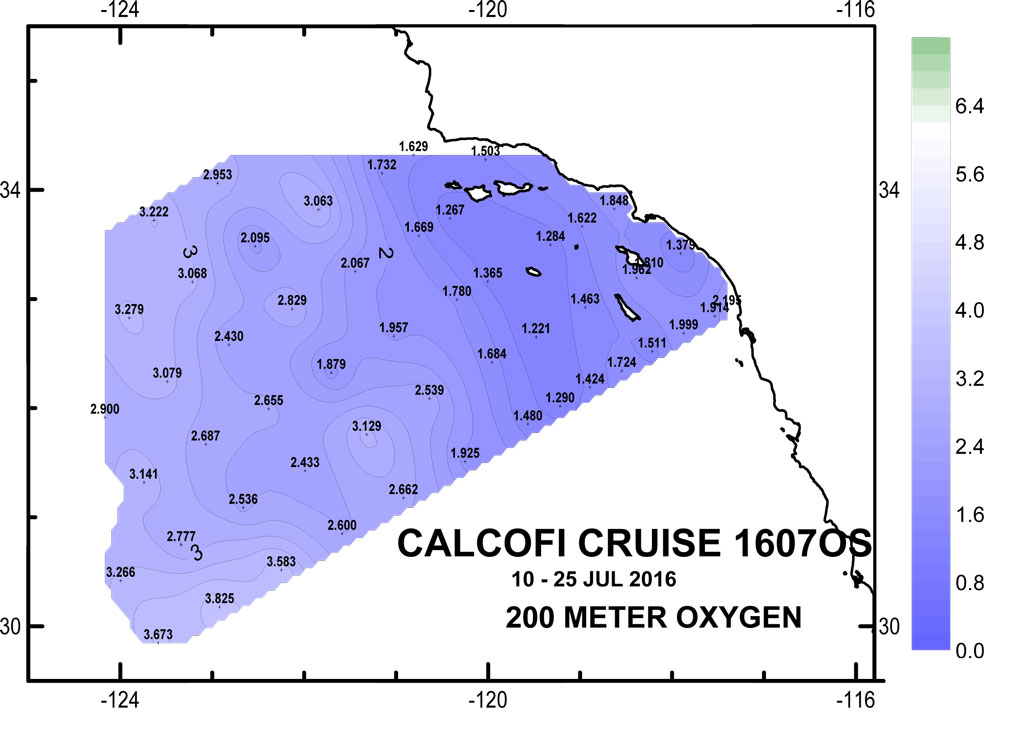
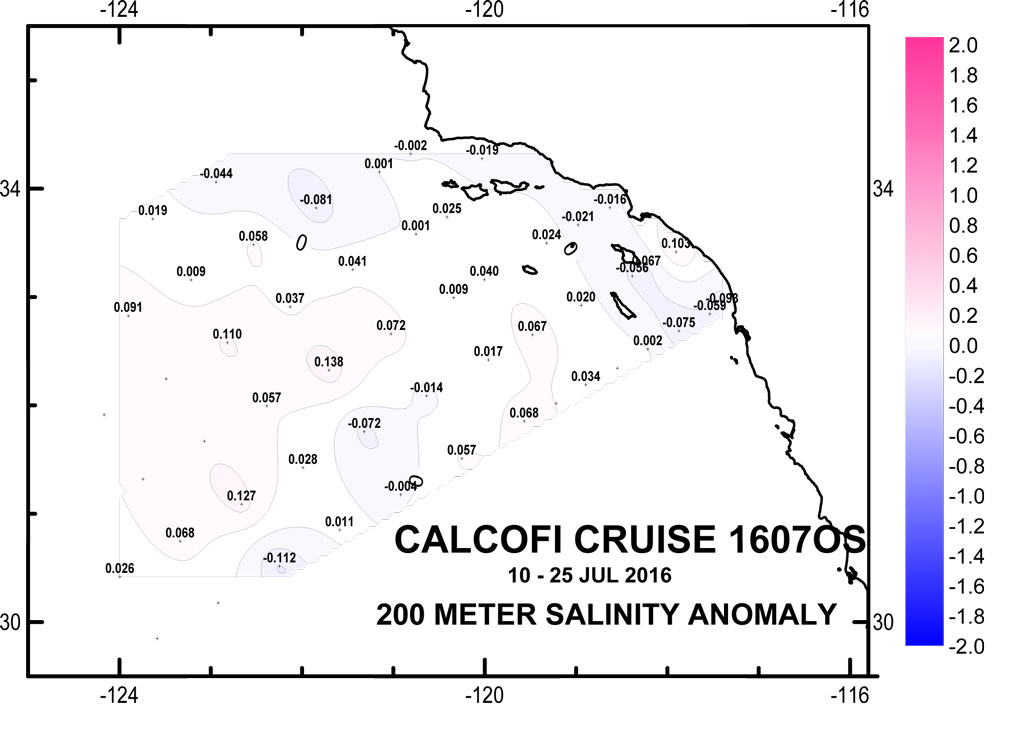
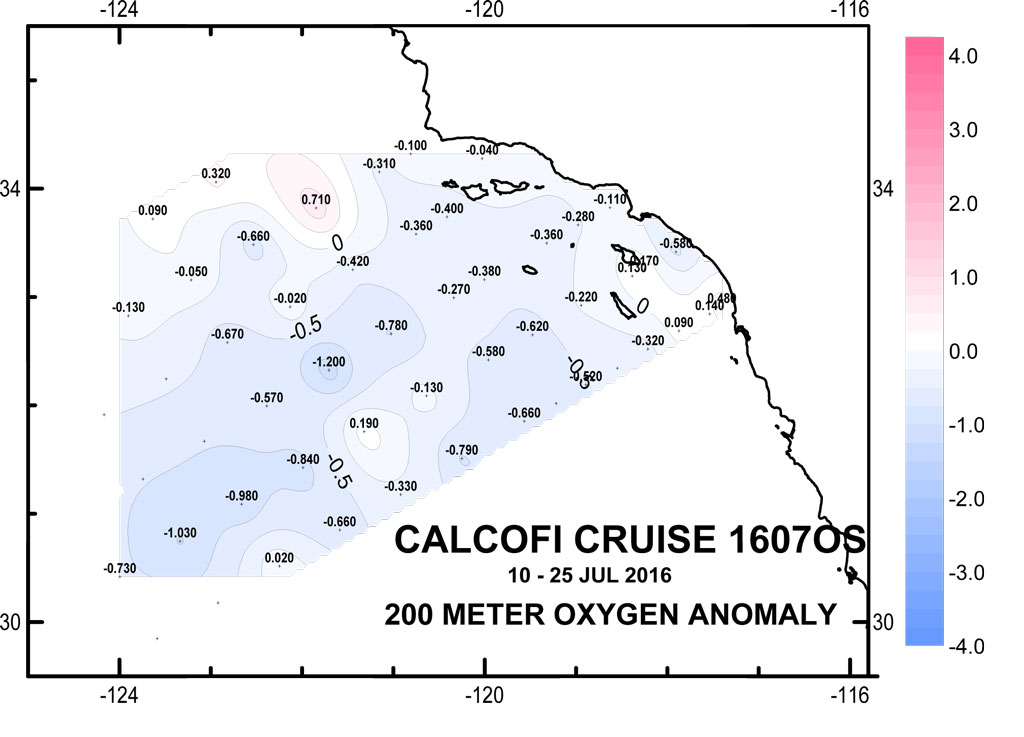
| 200 meters (Click for larger image) | ||
 |
 |
 |
 |
 |
 |
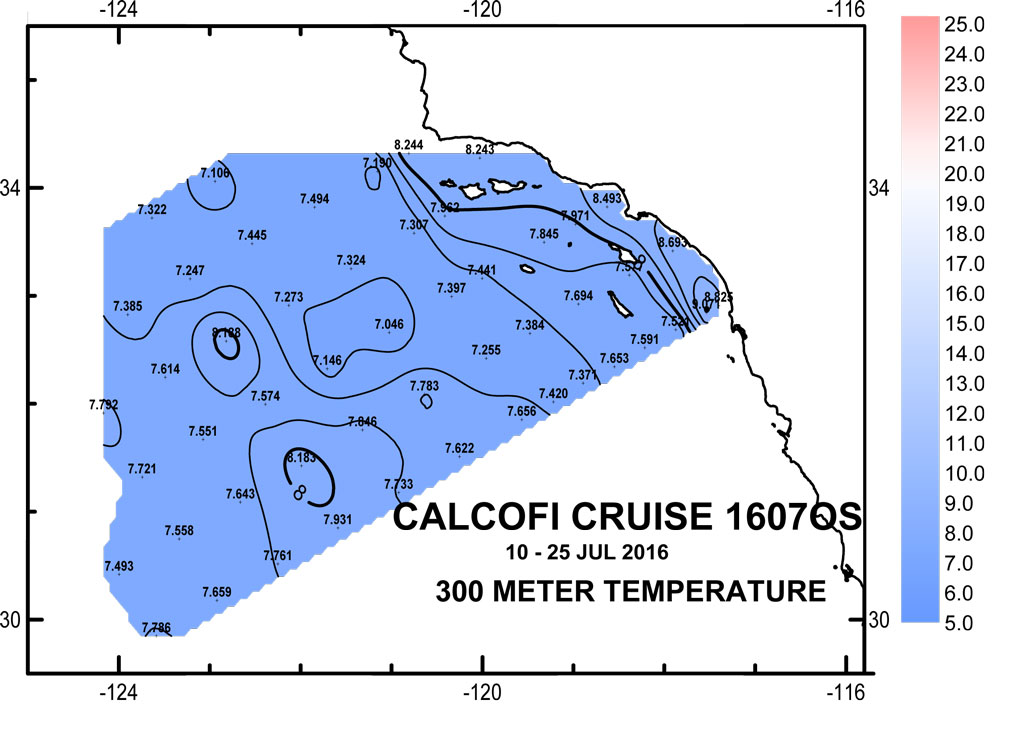
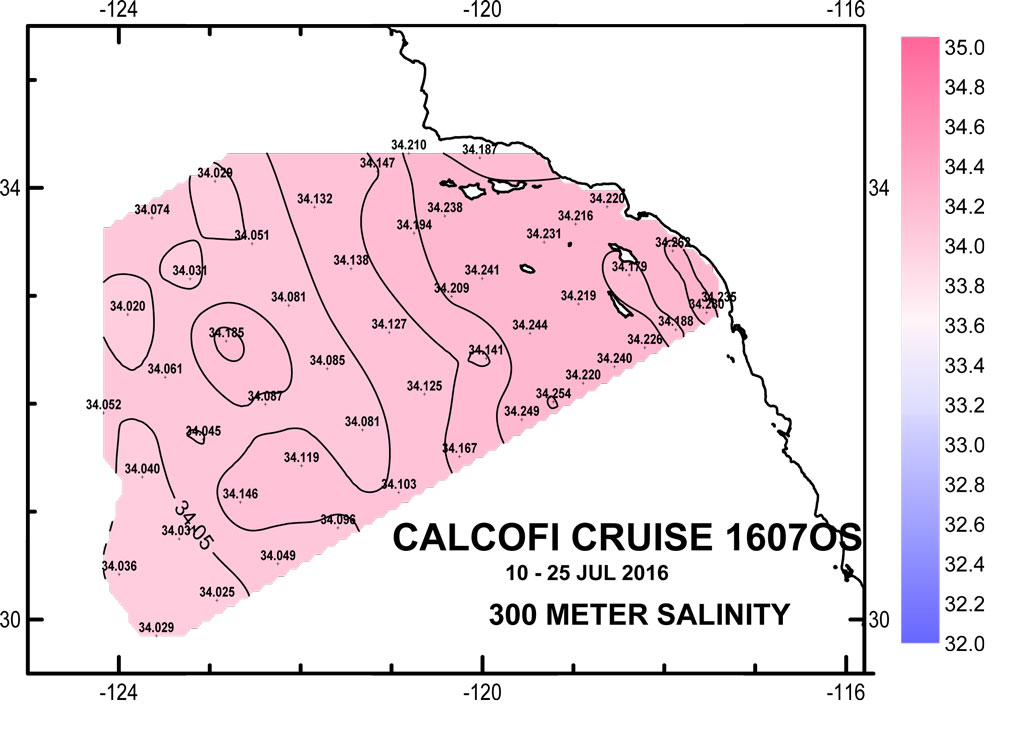
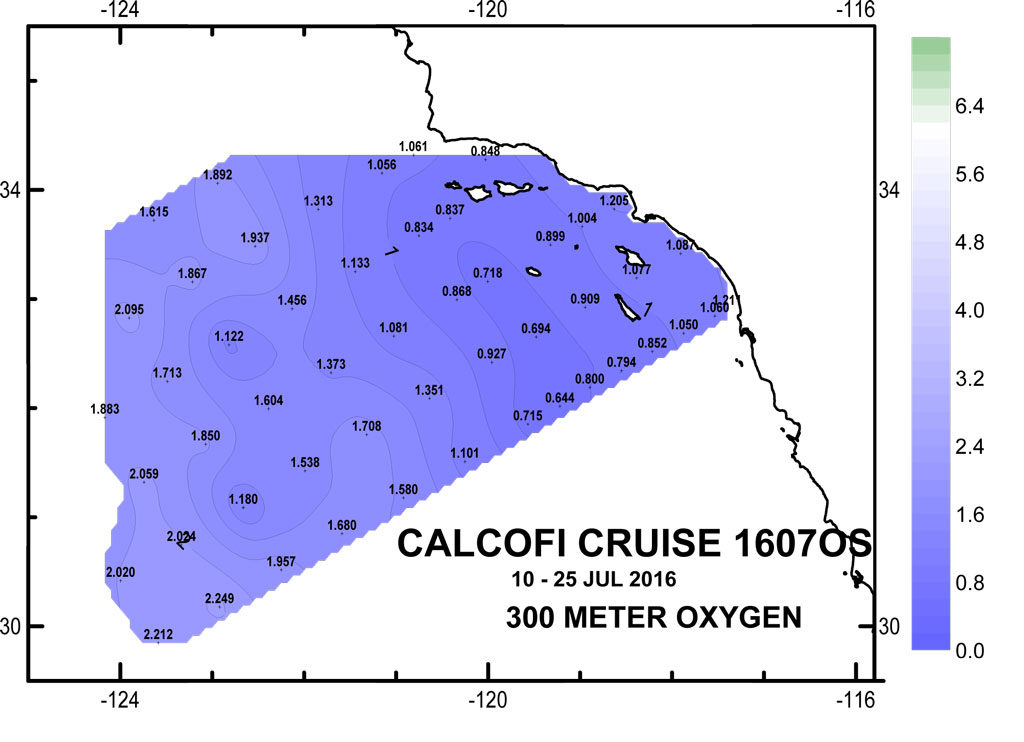
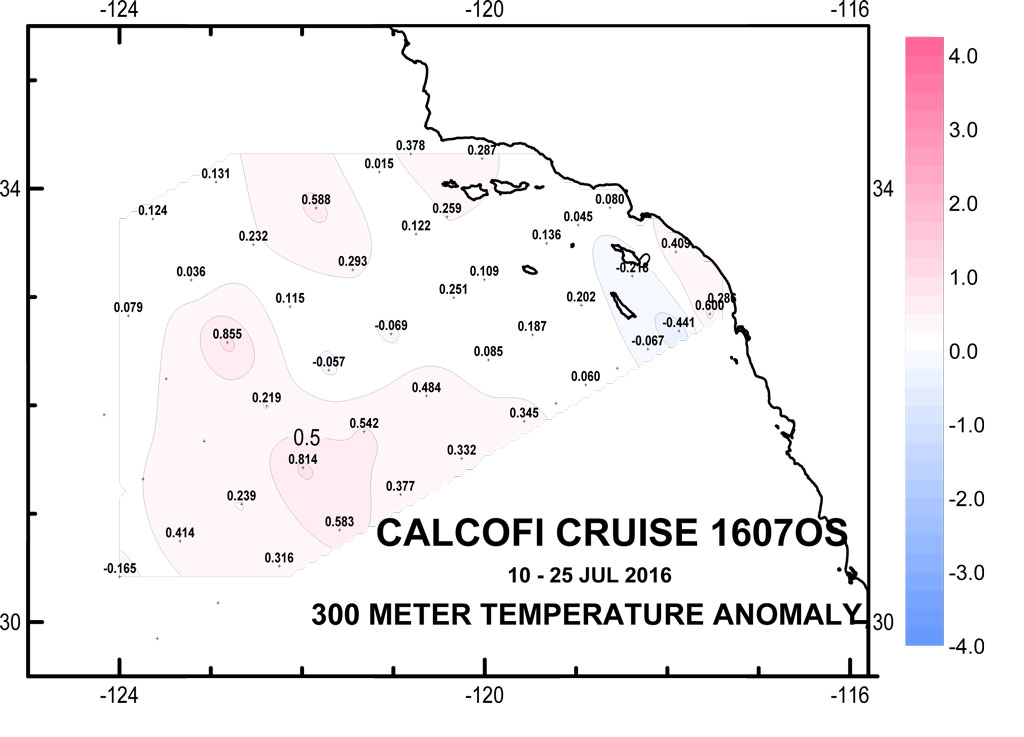
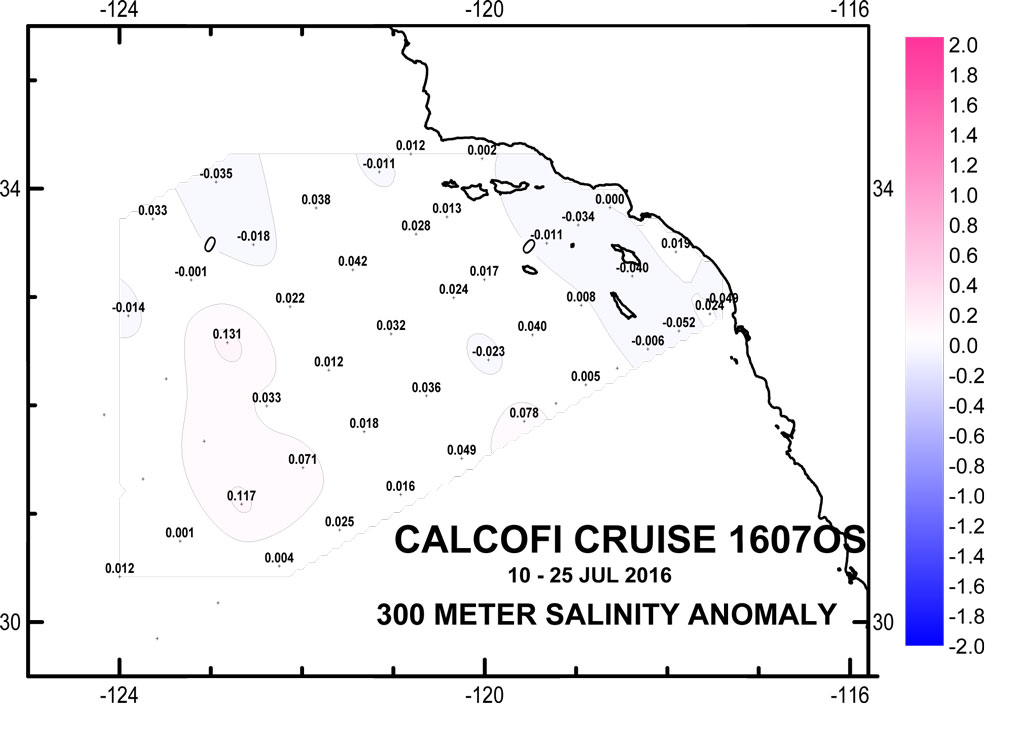
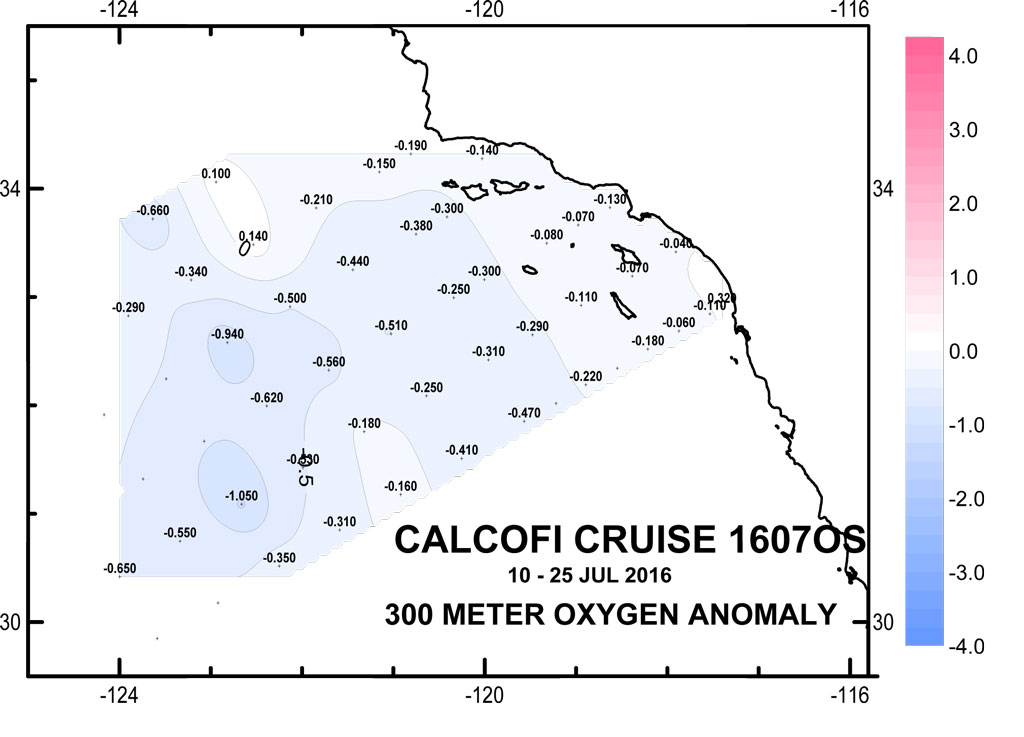
| 300 meter (Click for larger image) | ||
 |
 |
 |
 |
 |
 |