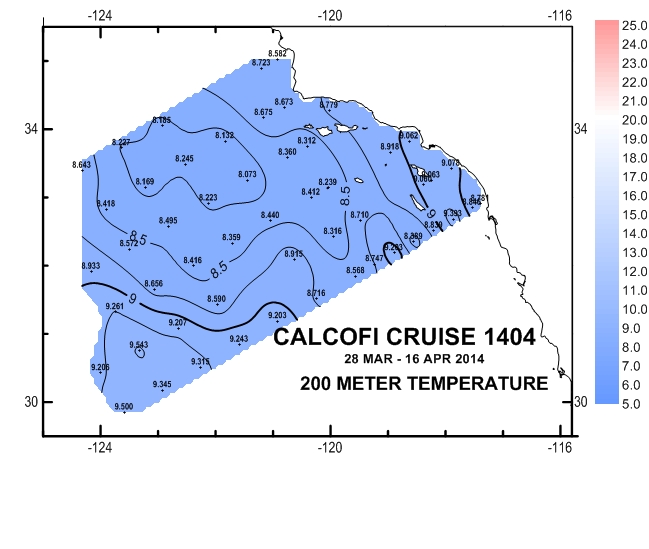
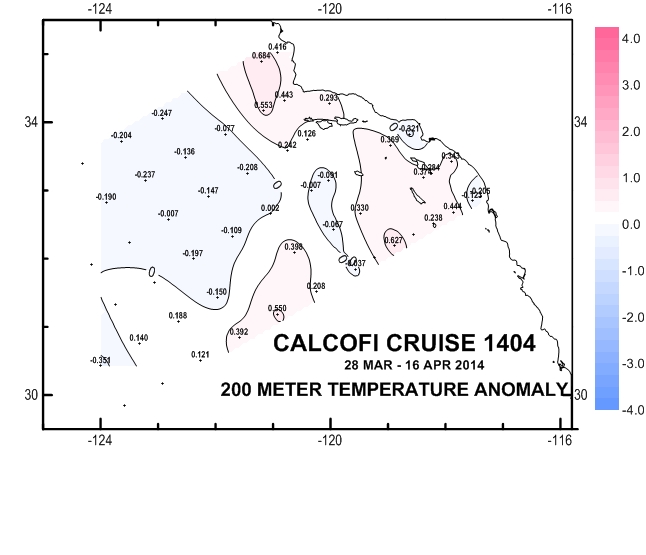
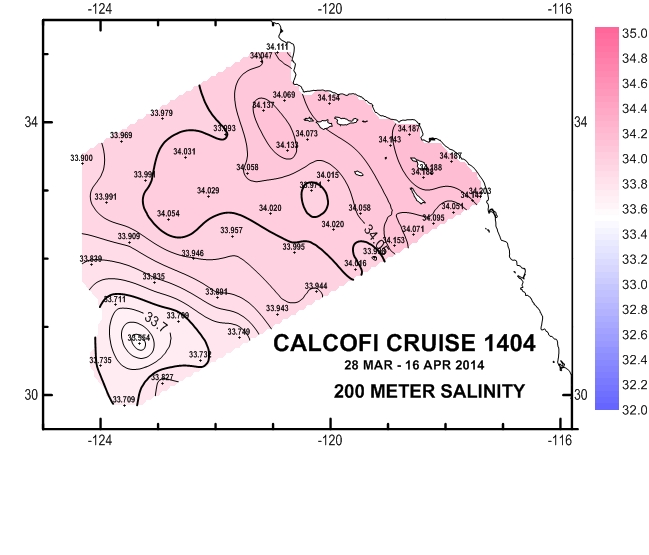
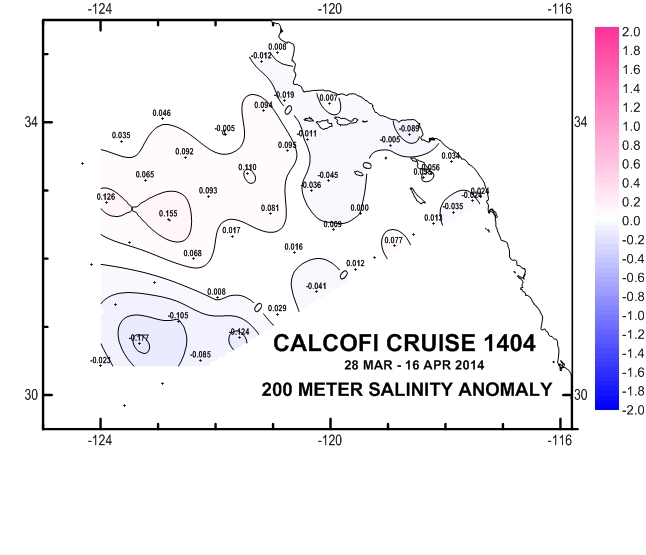
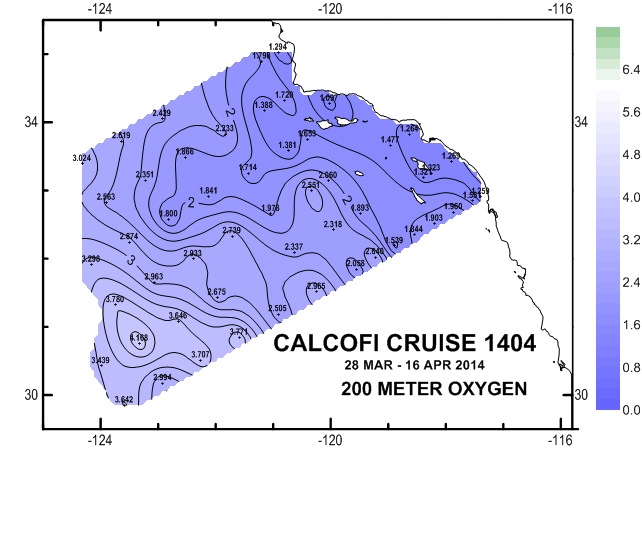
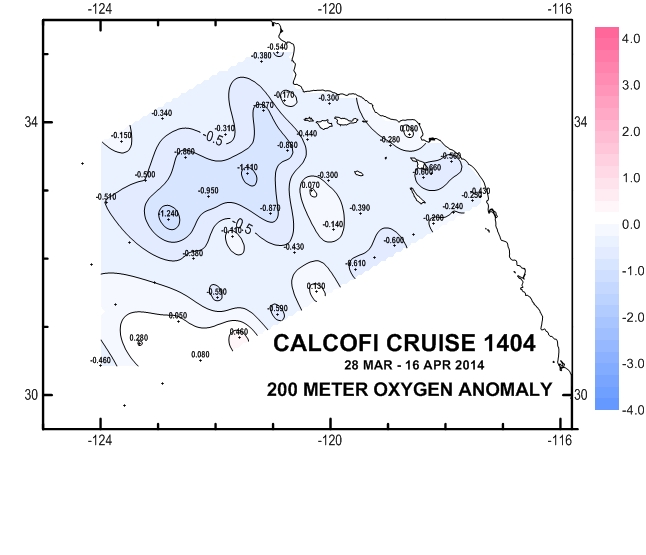
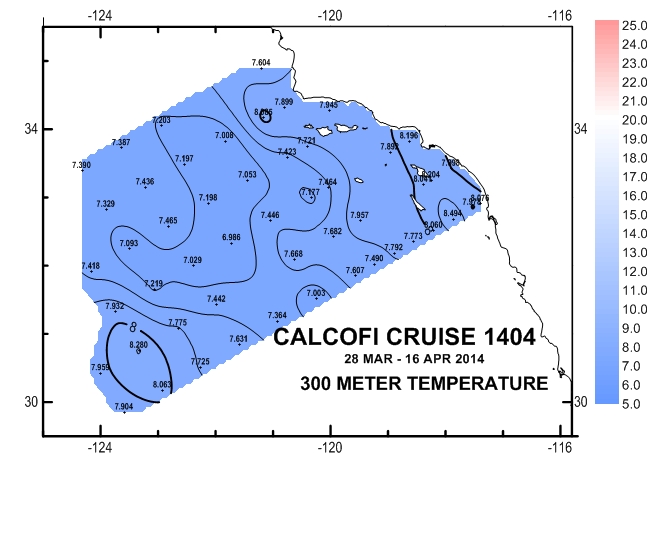
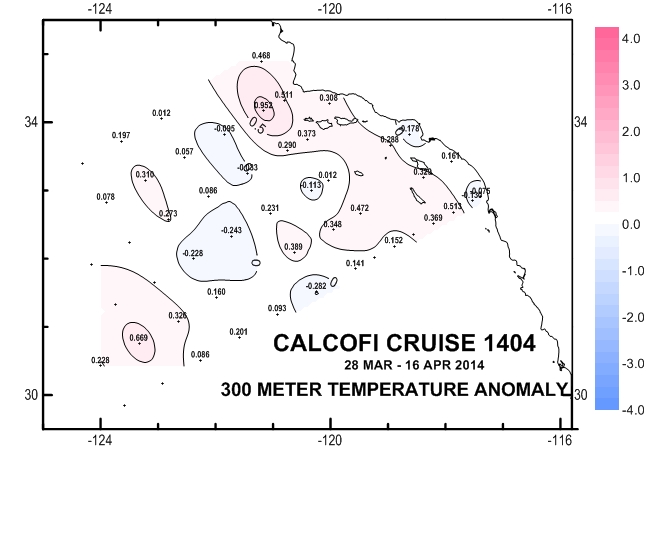
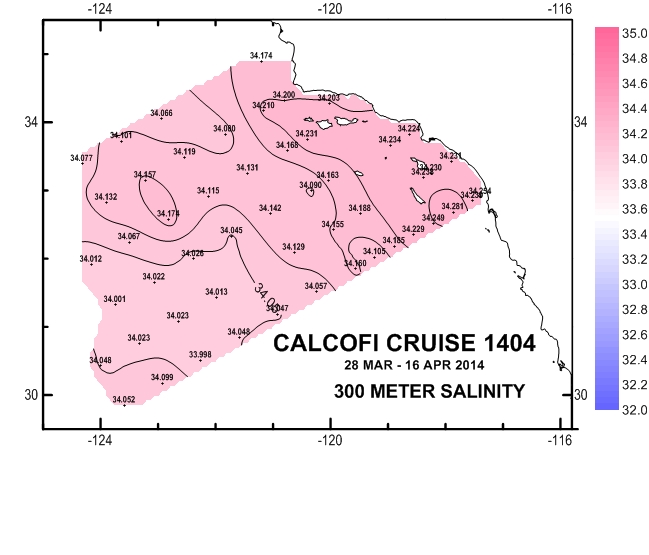
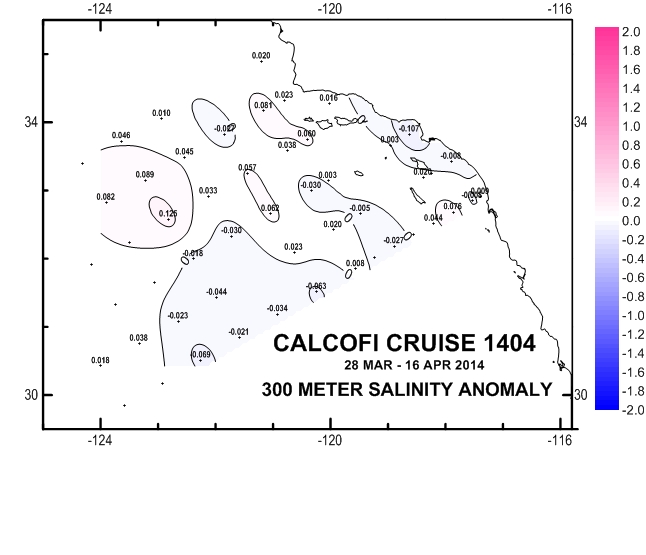
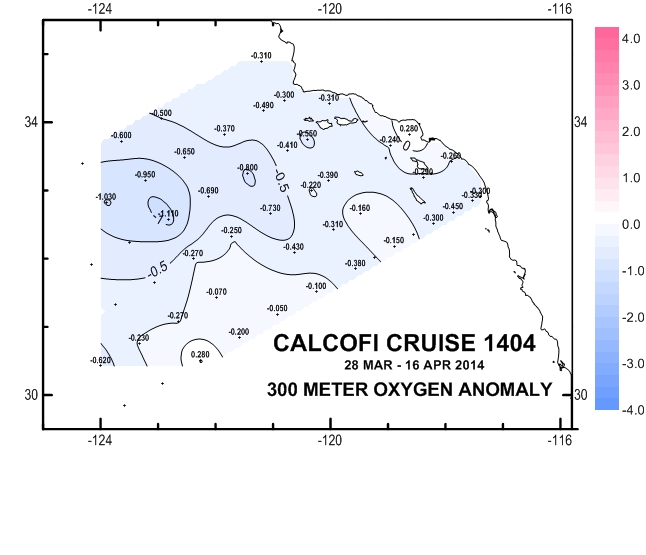
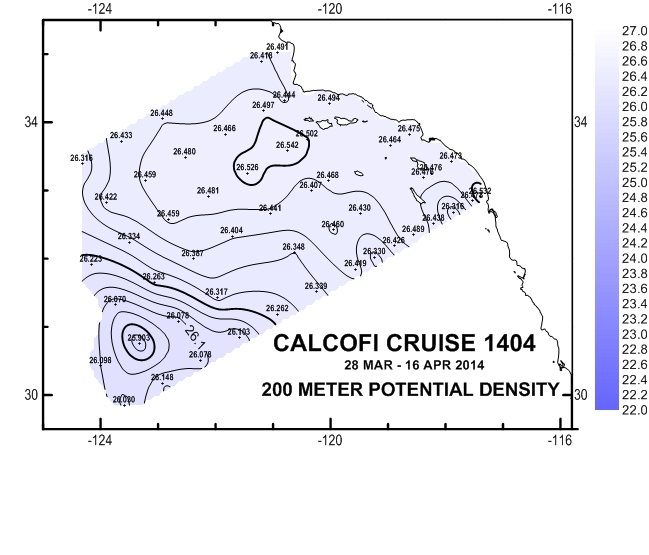
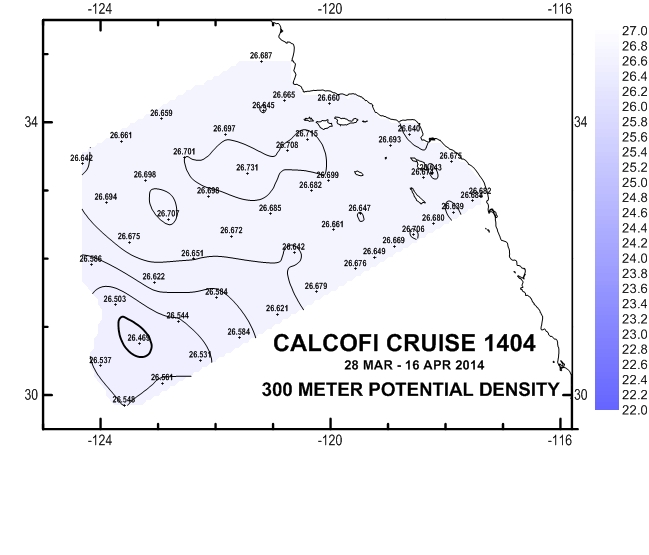
28 April 2014 Updated & Expanded Version - now includes 200m & 300m T, S, Sigma-theta, O2 data.
 |
 |
 |
 |
 |
 |
 |
 |
 |
 |
 |
 |
 |
 |
 |
 |
 |
 |
 |
 |
 |
 |
 |
 |
 |
 |
|
|
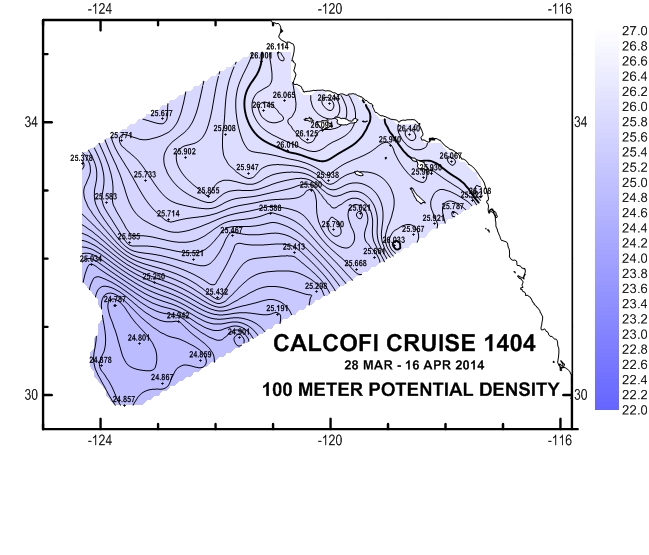
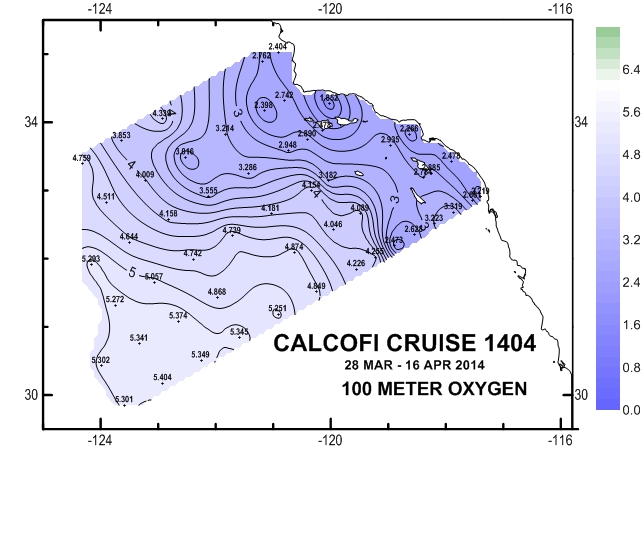
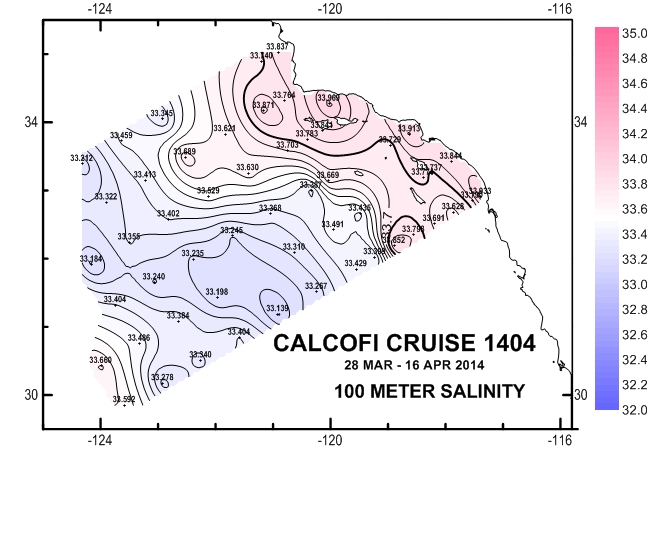
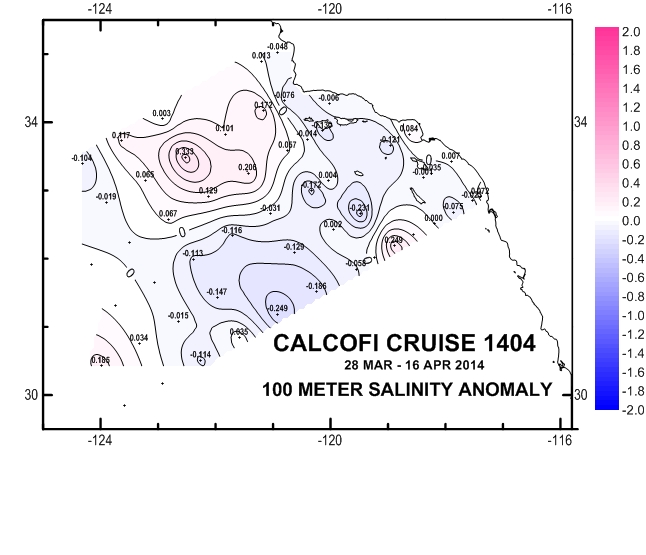
<right-click> the plot to view or save the full resolution jpg; <single-click> the plot to view the pdf.
Please note that the anomalies are based on 50-year harmonics and these data are non-bottle-corrected, Seasoft-processed CTD |
||