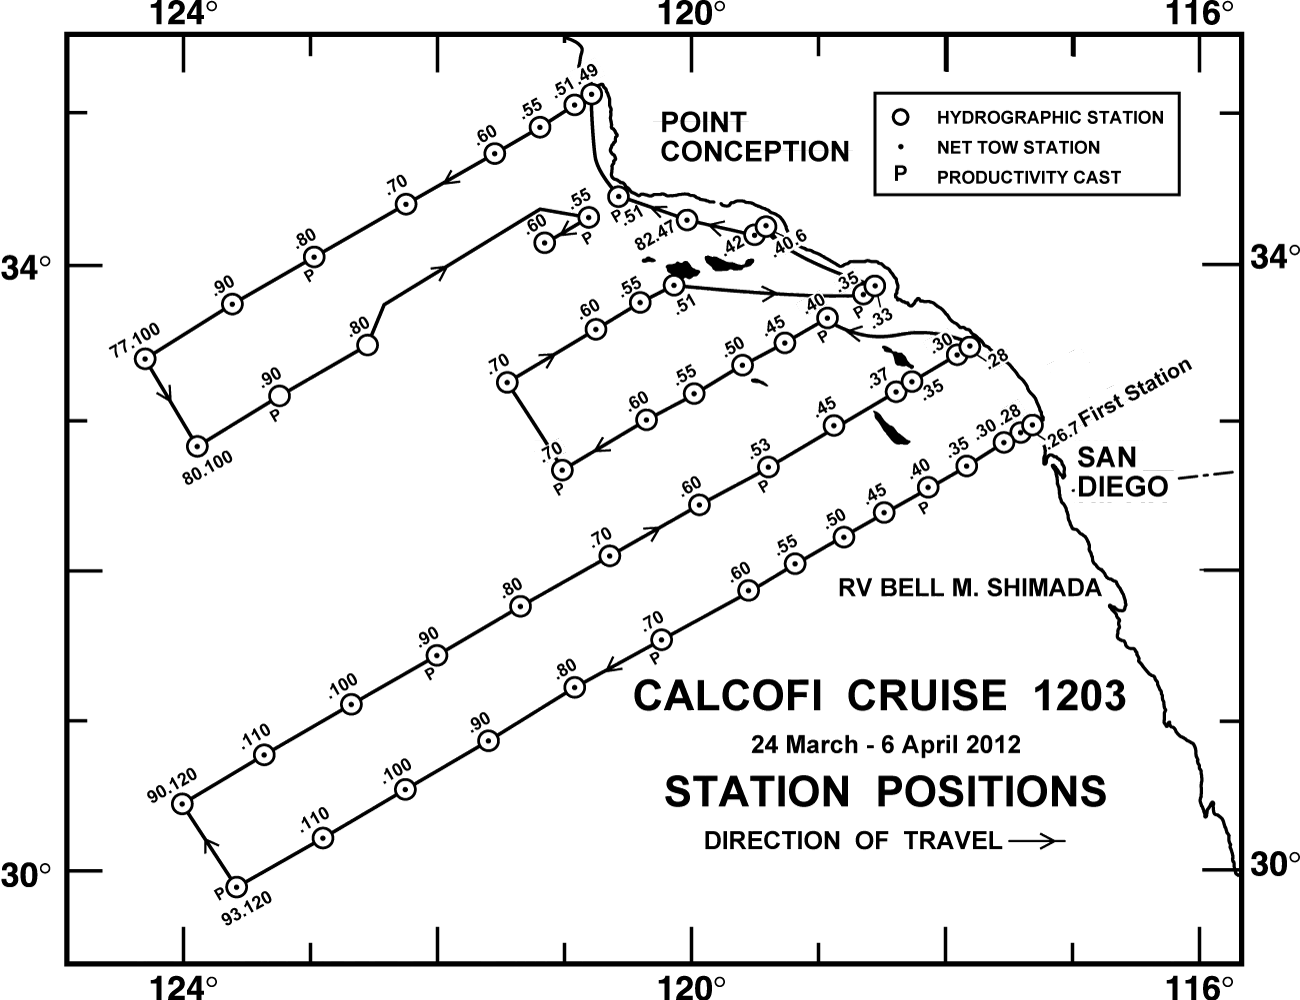
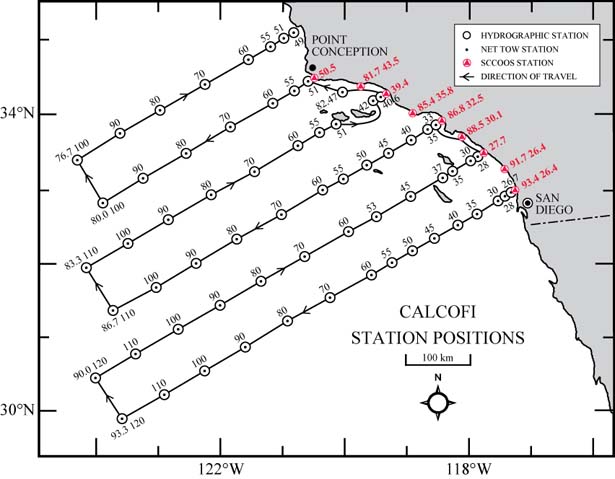
| Summary: | 57 standard stations occupied on this rough weather cruise - review the cruise track below. Stations not occupied : 87.80, 87.90, 87.100, 87.110, 83.110, 83.100, 83.90, 83.80, 80.70, 80.60 |
| Data Links: | 1203SH CTD Cast Files; Final bottle-corrected CTD csv, plots & metadata |
| Cruise ID: | CalCOFI 1203SH; 2012-03-17-C-325S |
| Cruise Dates: | Saturday, 24 Mar 2012 to Saturday, 07 Apr 2012 |
| Load Dates: | 22 - 23 Mar 2012, San Diego Broadway Cruise Terminal Pier |
| Ship: | NOAA RV Bell M Shimada |
| Station plan: | 66 Standard (66 CalCOFI + 0 SCCOOS) |
| Cruise Plan: | Cruise Plan for Legs 1 & 2 (PDF) |
| Cruise Map: |
 |
| Contacts: | Amy Hays, Cruise Leader, NMFS |
| James Wilkinson, Technical Coordinator, IOD-SIO | |
| Personnel: | Participants Leg 1 |
| Station Work: | Proposed station work |
Clickable Station Data Map
This map may not reflect the actual cruise track and stations completed.
 |
| CTD Processing Summary CalCOFI 1203SH CTD Data | |||
| Download 1203SH CTD raw cast files zipped | Download 1203SH FinalQC CTD + bottle data with data-quality codes | ||
| General CTD Notes - data acquisition notes, logistics, processing - see below | |||
| CTD sensor corrections derived by comparing 4 secs of CTD sensor data (prior to bottle closure) to bottle samples | |||
| Dual T, S, & O2 | Primary Sensor | Secondary Sensor | |
| Salinity offset (bottle - CTD salinity; > 350m only; Seabird SBE3+ & SBE4) | 0.0040 | 0.0050 | |
| Oxygen mL/L (dual Seabird SBE43) |
y = 1.0508x - 0.0179 R² = 0.9998 |
y = 1.0502x - 0.0245 R² = 0.9998 |
|
| Oxygen umole/Kg (dual Seabird SBE43) |
y = 1.0501x - 0.4551 R² = 0.9924 |
y = 1.0527x - 0.9669 R² = 0.9997 |
|
| Single sensors | |||
| Nitrate - ISUS 4sec ave voltage vs Bottle Nitrate (Satlantic MBARI-ISUS v2) |
y = 28.903x - 7.2353 R² = 0.9905 |
||
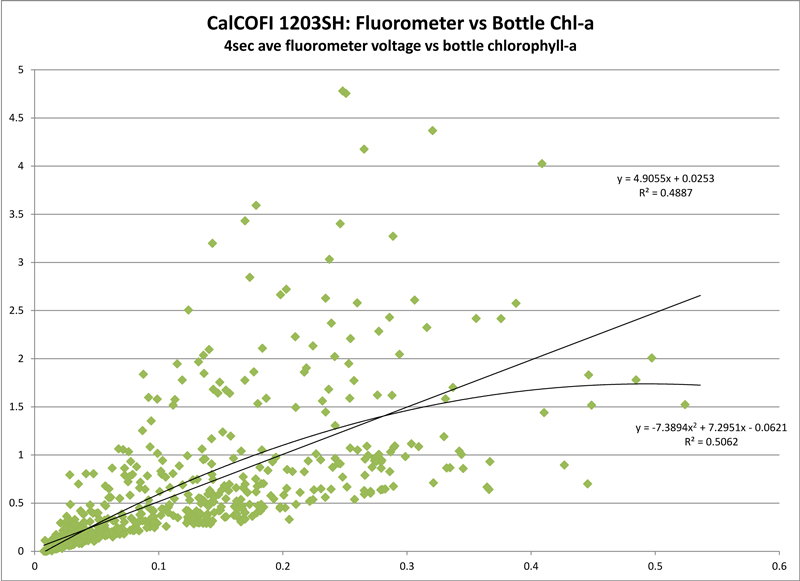
| Fluorometer - linear & polynomial regressions |
y= 4.9055x + 0.0253 R² = 0.4887 |
y= -7.3894x2 + 7.2951x - 0.0621 R² = 0.5062 |
|
 |
|
||
") |
") |
||
 |
 |
||
|
General Note on 1203SH CTD Casts & Processing
|
|||