CalCOFI 1607OS
| Summary: | CalCOFI 1607OS sailed from 10th Ave Marine Terminal San Diego July 10 2016 at 0800PDT and returned as scheduled July 27 2016. Offloading started upon arrival to San Diego. 68 stations (60 standard and 8 SCCOOS stations) were successfully occupied. Please refer to the preliminary data plots web page and data links below for preliminary data. The typical 75-station summer station pattern was scheduled but due to high winds and rough seas west of Pt. Conception, ~ 26 hours were lost. All of Line 80 stations were completed but several stations on Line 77 were missed as ship-time ran out due to weather delays and long transit times. Stations missed: 77.100, 77.70, 77.60, 77.55, 77.51, 77.49, SCCOOS 85.8 35.8. |
| Data Files: | 1607OS Raw CTD Cast Files; FinalQC CTD+Bottle Data Files; Prelim. Horizontal Contour Plots |
| Cruise Instructions: | Instructions Web Page | NOAA Cruise Instructions PDF |
| Load Dates: | 08 - 09 Jul 2016 (Fri-Sat), 10th Ave Marine Terminal, 1839 Water Street, San Diego, CA 92101 |
| Cruise Dates: | 10 - 27 Jul 2016 (Sun - Wed) |
| Offload Date: | 27 Jul 2016 (day-of-return; Wed) at 10th Ave Marine Terminal, San Diego CA |
| Ship: | RV Ocean Starr |
| Station plan: | 75 Standard (66 CalCOFI + 9 SCCOOS) |
| Cruise Map: | Actual cruise track, red stations were not occupied this cruise. |
 |
|
| Contacts: | Amy Hays, Chief Scientist, SWFSC-NOAA |
| Dave Wolgast, Technical Coordinator, IOD SIO-CalCOFI | |
| Jennifer Rodgers-Wolgast, IOD SIO-CalCOFI Volunteer Coordinator | |
| CTD Processing Summary CalCOFI 1607OS CTD Final Data | |||
| Download 1607OS CTD raw cast files zipped | Download 1607 FinalQC CTD + bottle data | ||
| General CTD Notes - data acquisition notes, logistics, processing - see below. Please note that these regressions are generated from Final CTD vs bottle data and have gone through SIO-CalCOFI's strict data processing and point-checking protocol. CTD temperatures and salinities may not have changed from preliminary data but oxygen, estimated chlorophyll-a, estimated nitrate may change significantly after point-checking. Questionable or mistrip bottle data are removed from these comparisons but may be visible on the CTD.csv plots. For this cruise and future cruises, both primary & secondary sensor profiles vs bottle data will be generated and archived in the downloadable CTD+Bottle data files. These plots are under the "csv-plots\Primary" & "csv-plots\Secondary" subdirectories. |
|||
| CTD sensor corrections derived by comparing CTD sensor data, 4sec average prior to bottle closure, to bottle samples | |||
| Dual T, S, & O2 | Primary Sensor | Secondary Sensor | |
| Salinity offset (bottle - CTD salinity; > 350m only; Seabird SBE4) | -0.0016 | 0.0053 | |
| Oxygen ml/L (dual Seabird SBE43) | y = 1.0545x - 0.0193 R² = 0.9995 |
y = 1.0537x - 0.0245 R² = 0.9995 |
|
| Oxygen umol/Kg (dual Seabird SBE43) | y = 1.056x - 0.7146 R² = 0.9996 |
y = 1.0552x - 0.9304 R² = 0.9995 |
|
| Single sensors | Linear | Polynomial | |
| Nitrate - ISUS 4sec ave voltage vs Bottle Nitrate (Satlantic MBARI-ISUS v2) | y = 30.457x - 1.4193 R² = 0.9946 |
||
| Fluorometer - linear & polynomial regressions |
y = 6.9049x - 0.161 R² = 0.7635 |
y = -0.4899x2 + 7.1037x - 0.1706 R² = 0.7637 |
|
 |
 |
||
 |
 |
||
 |
 |
||
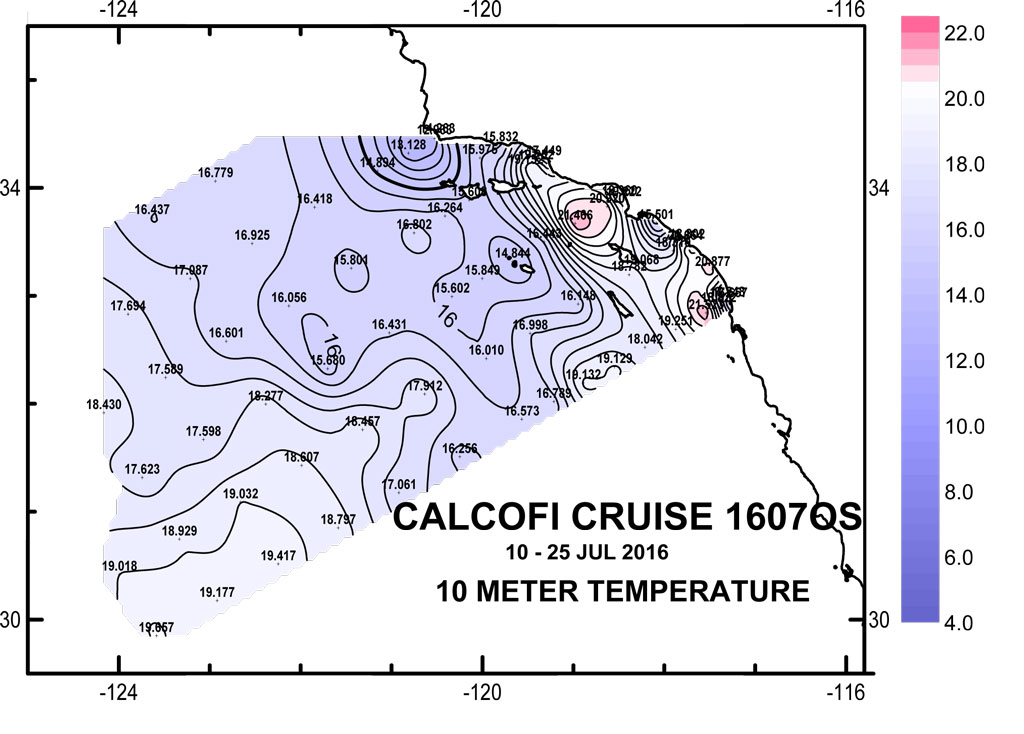
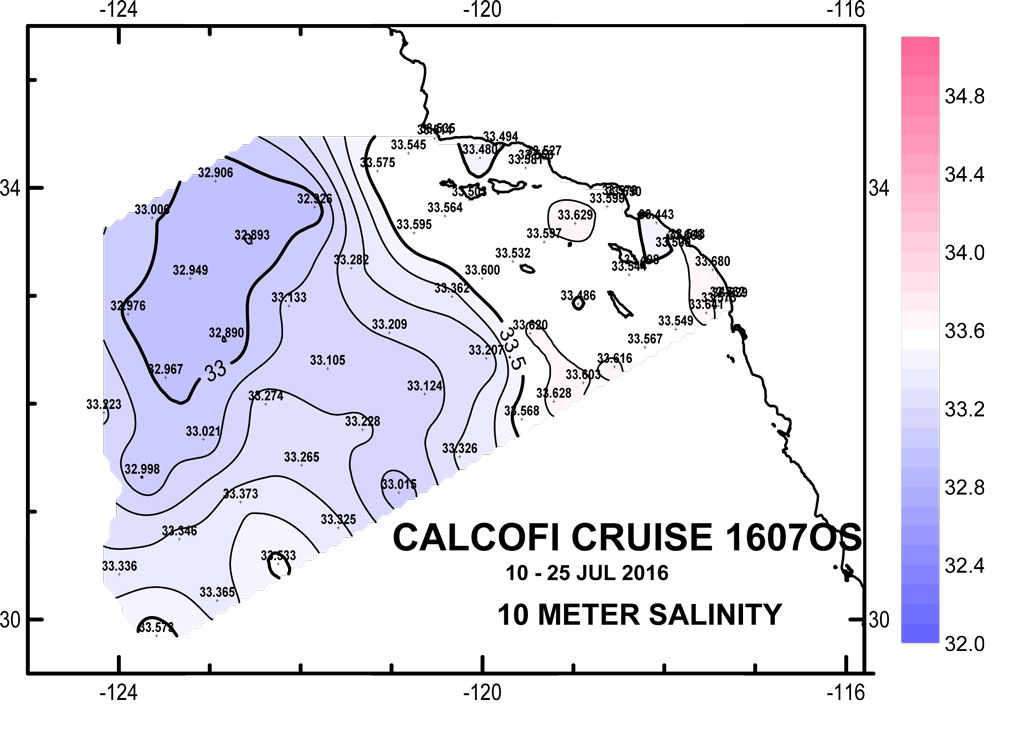
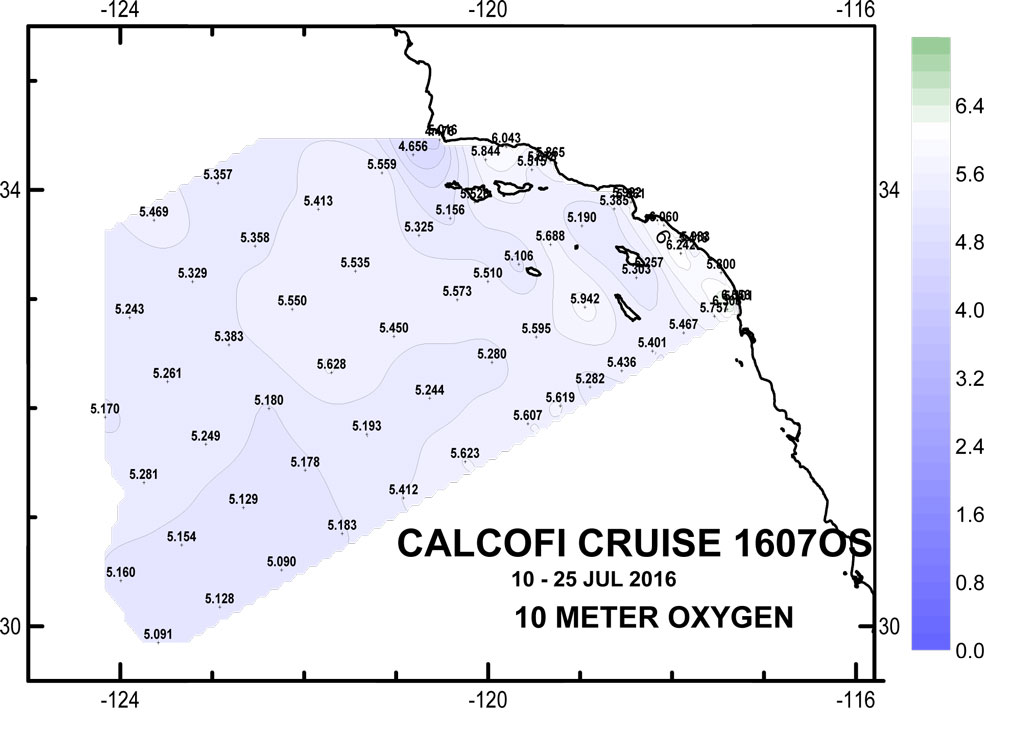
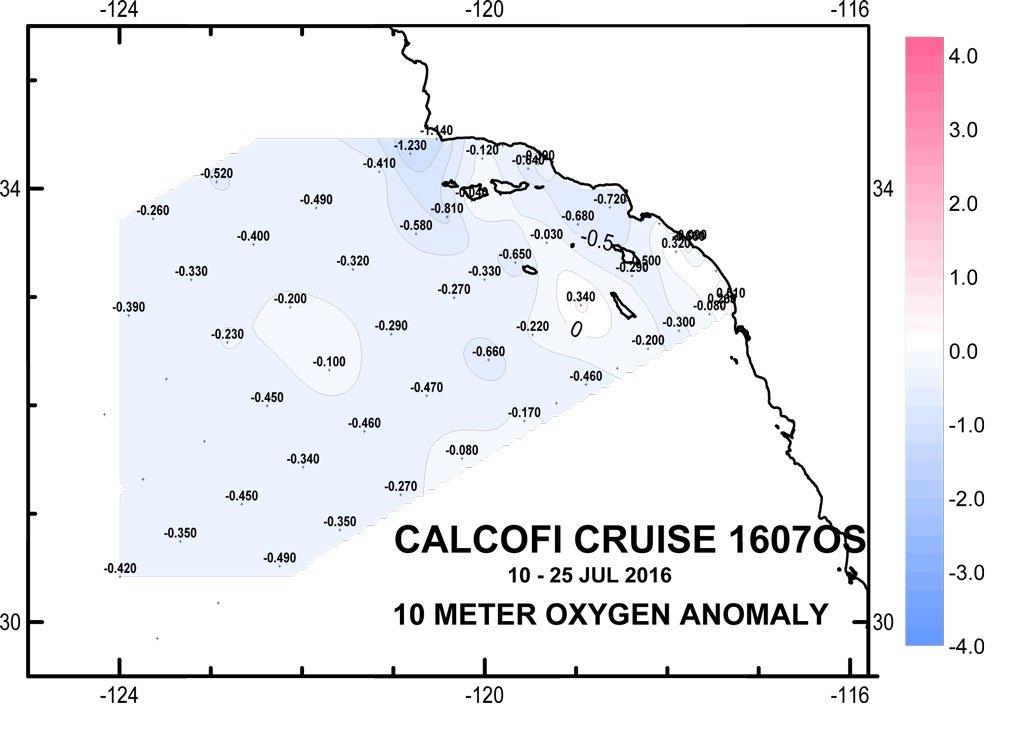
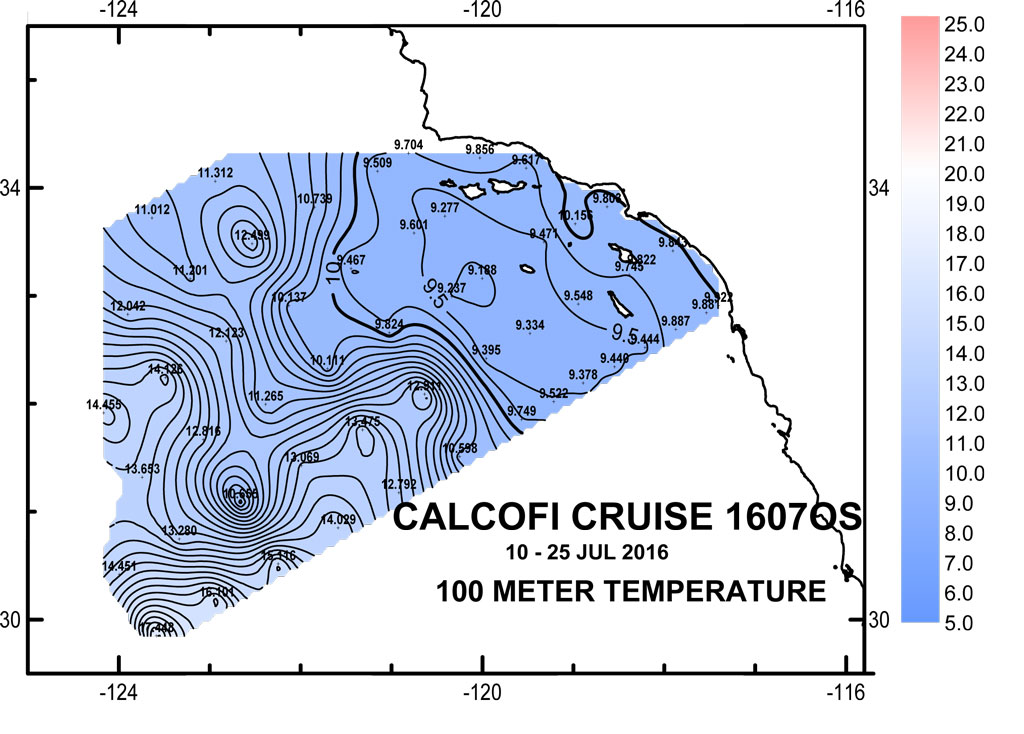
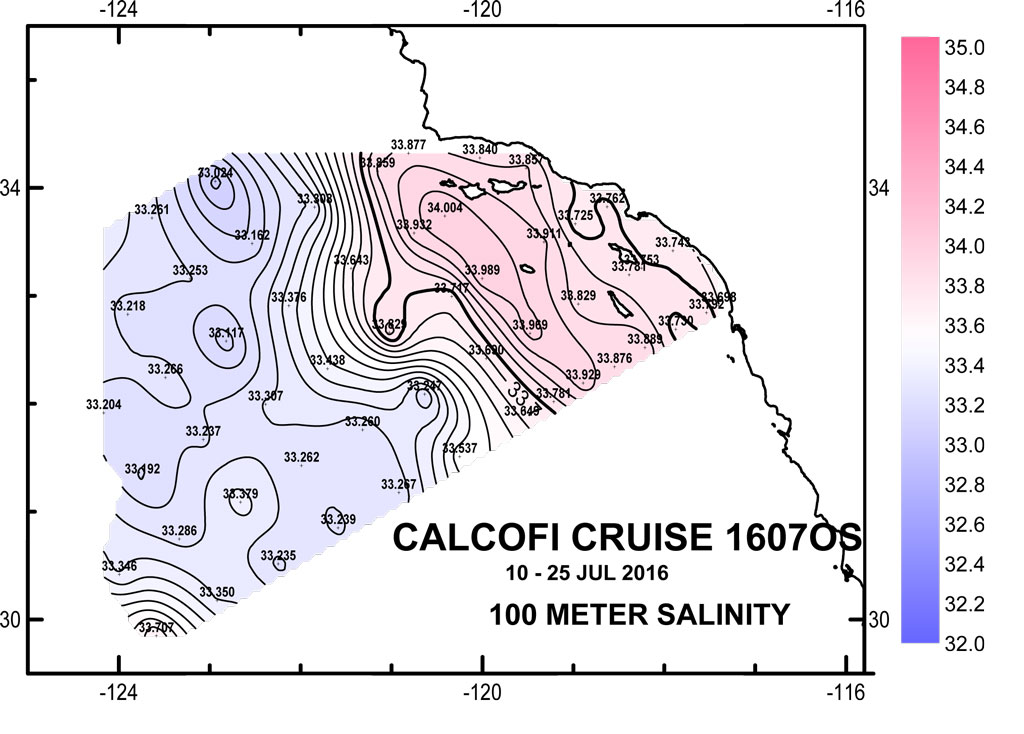
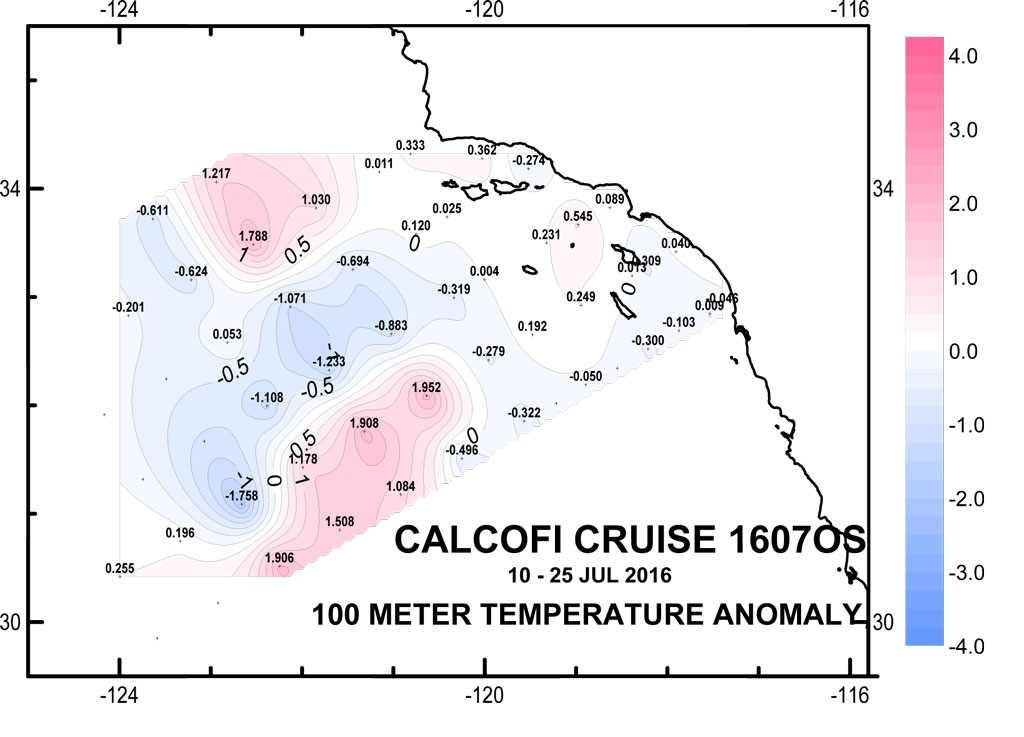
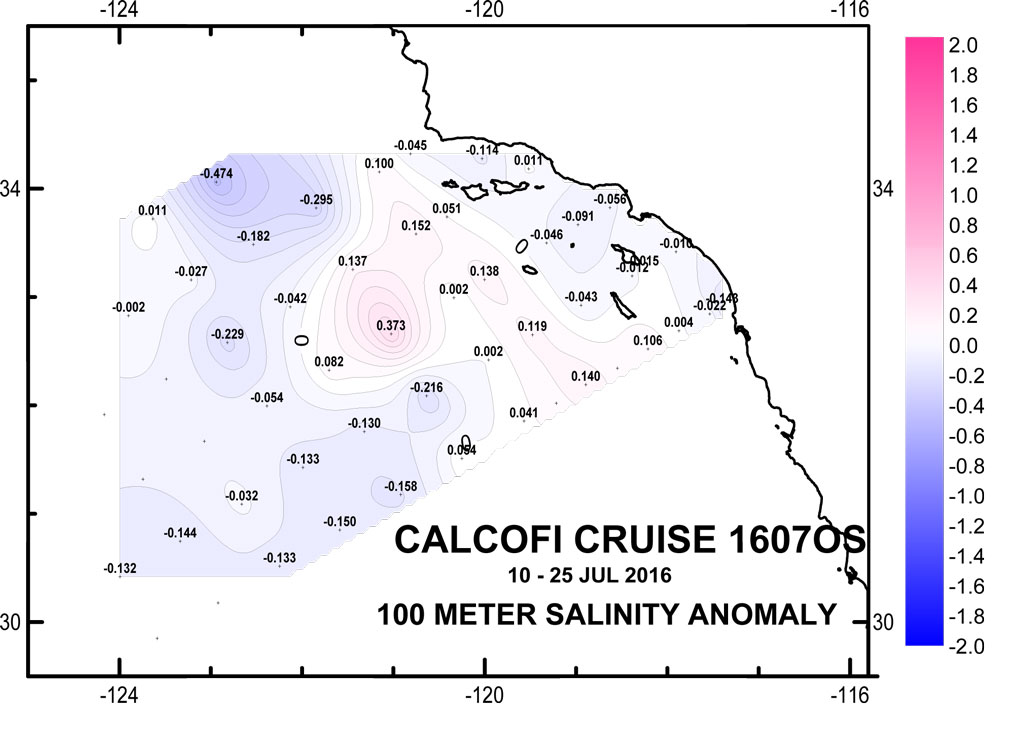
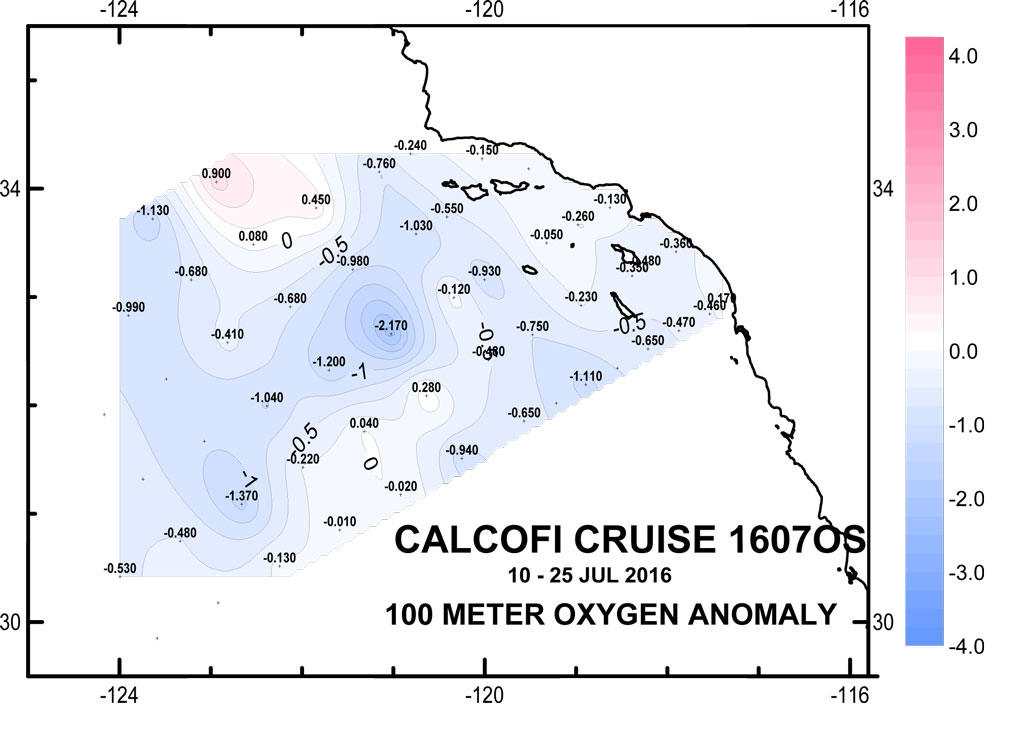
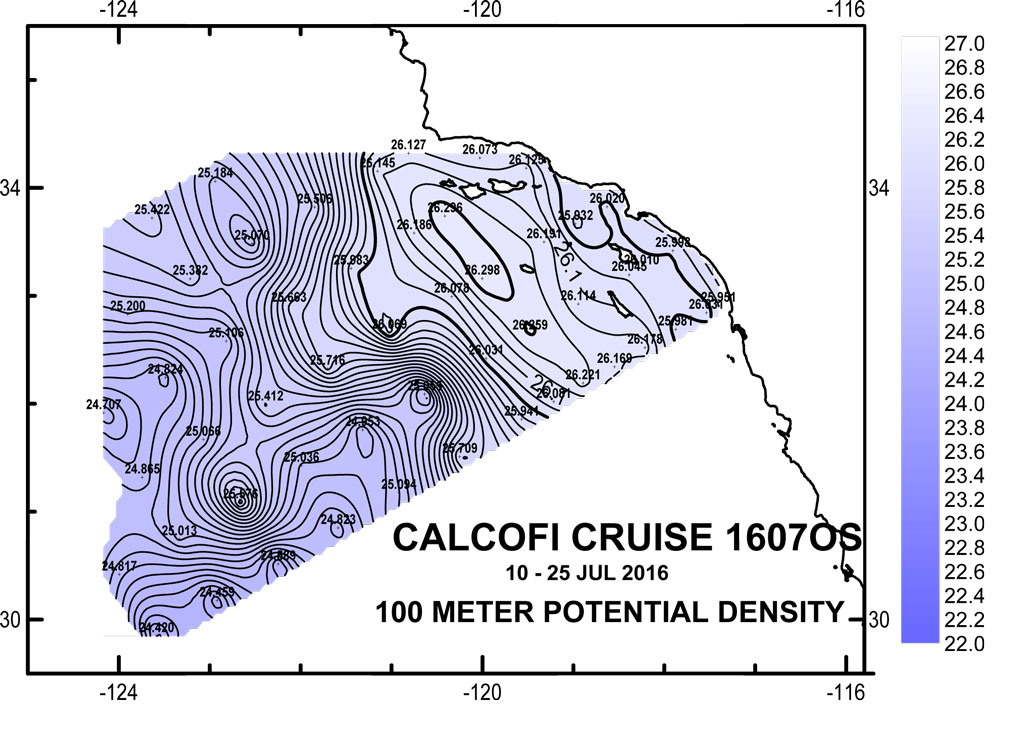
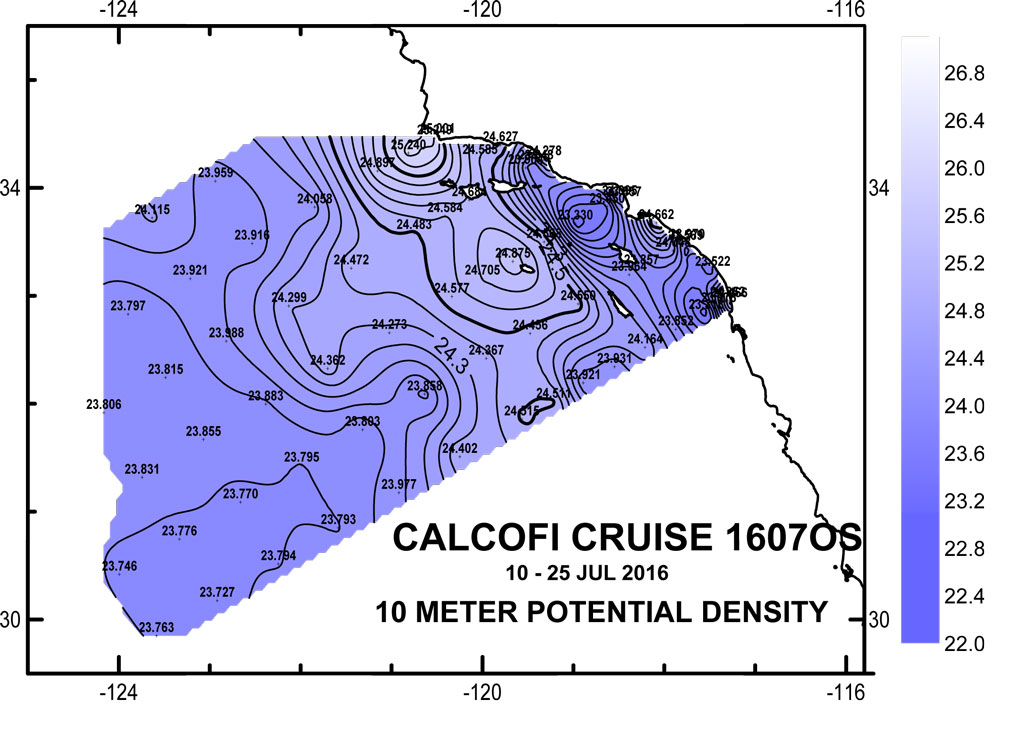
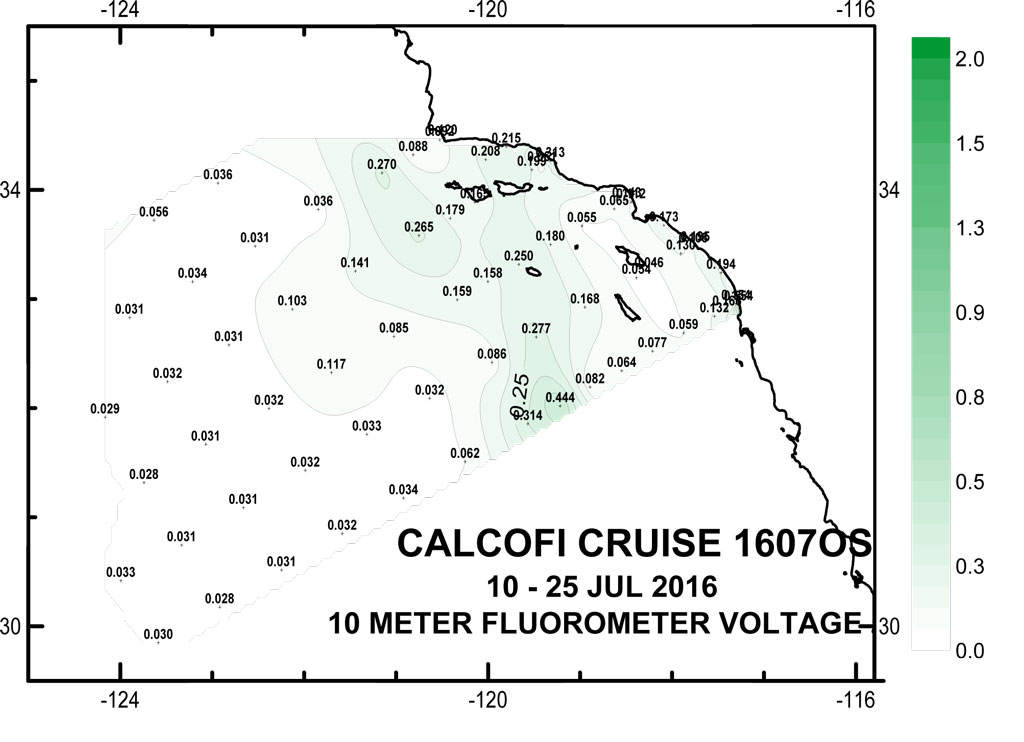
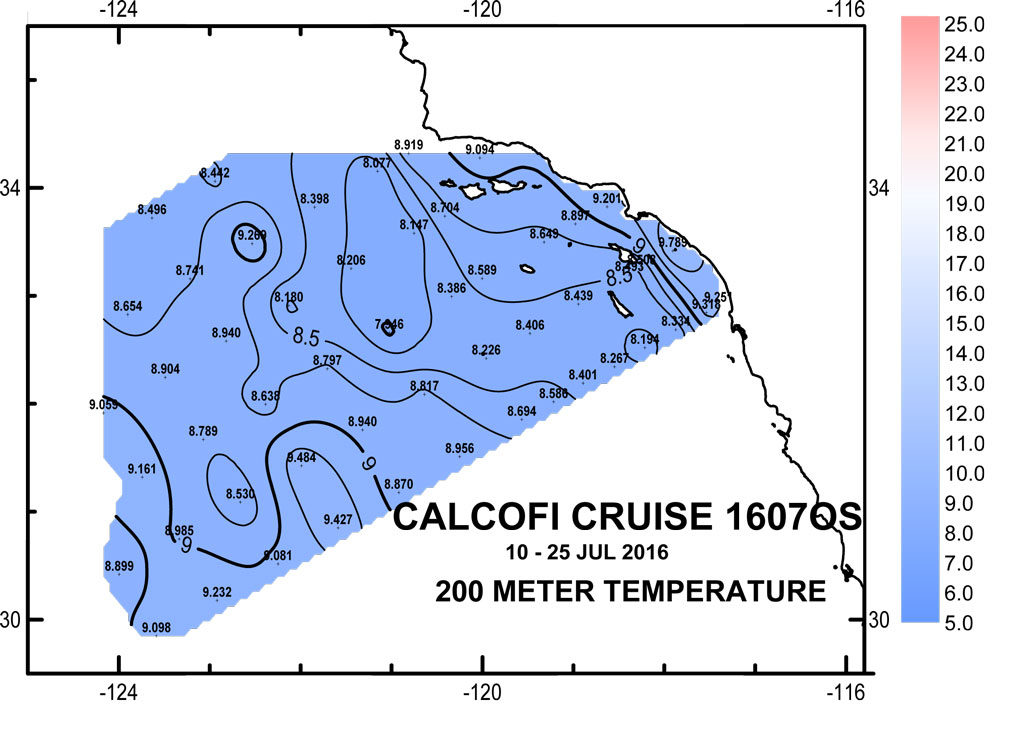
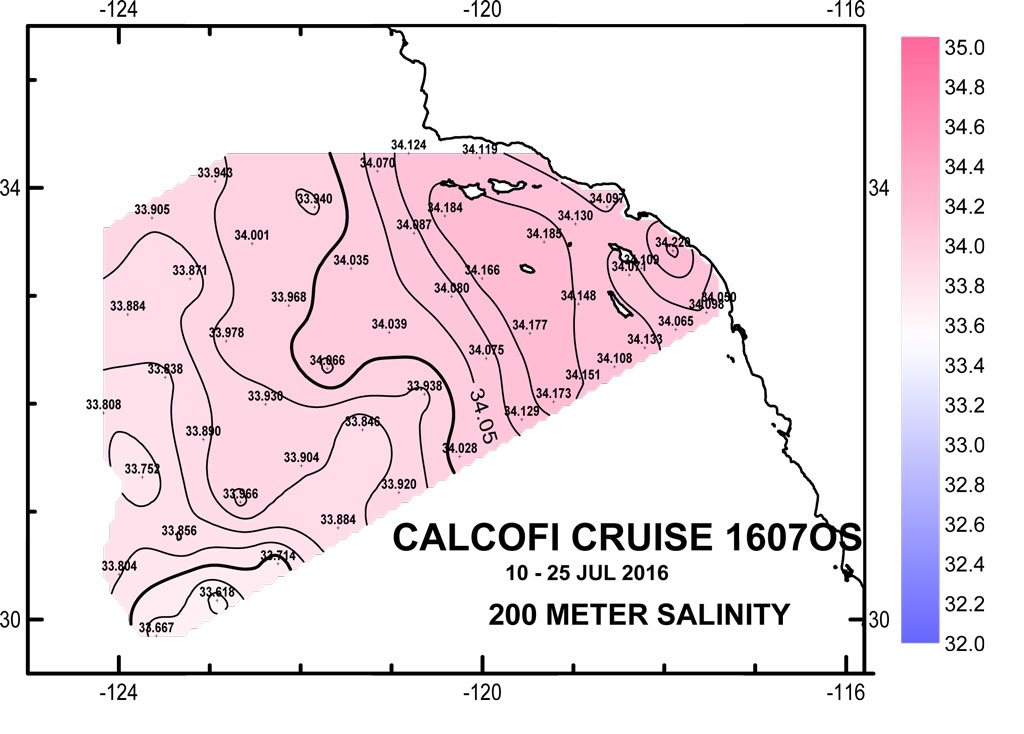
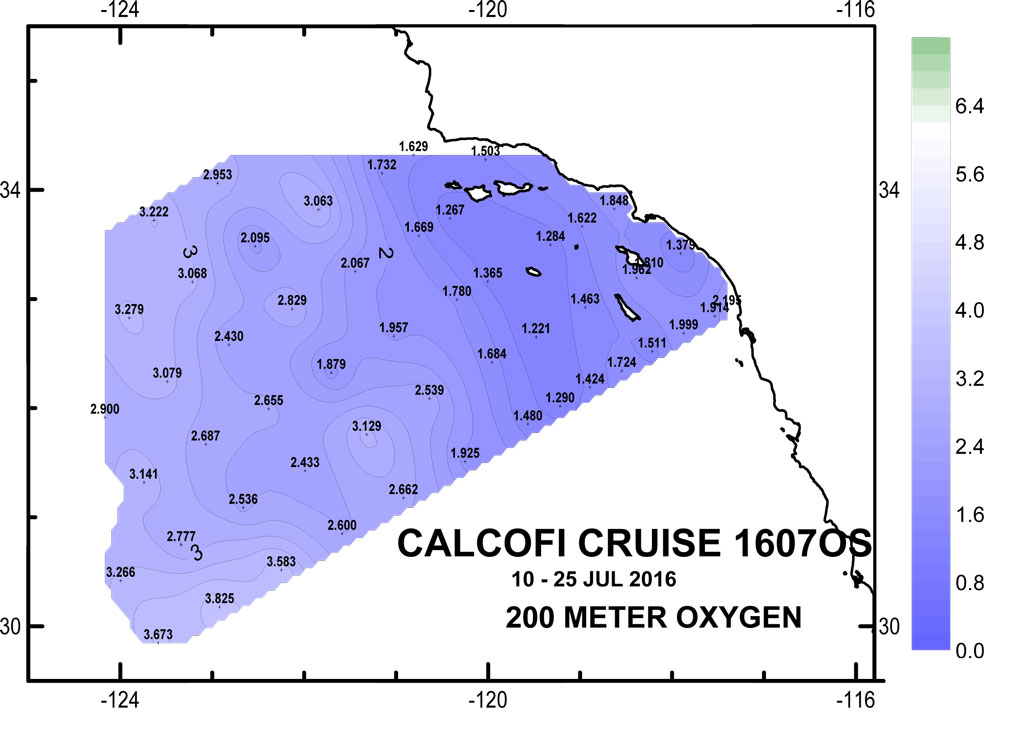
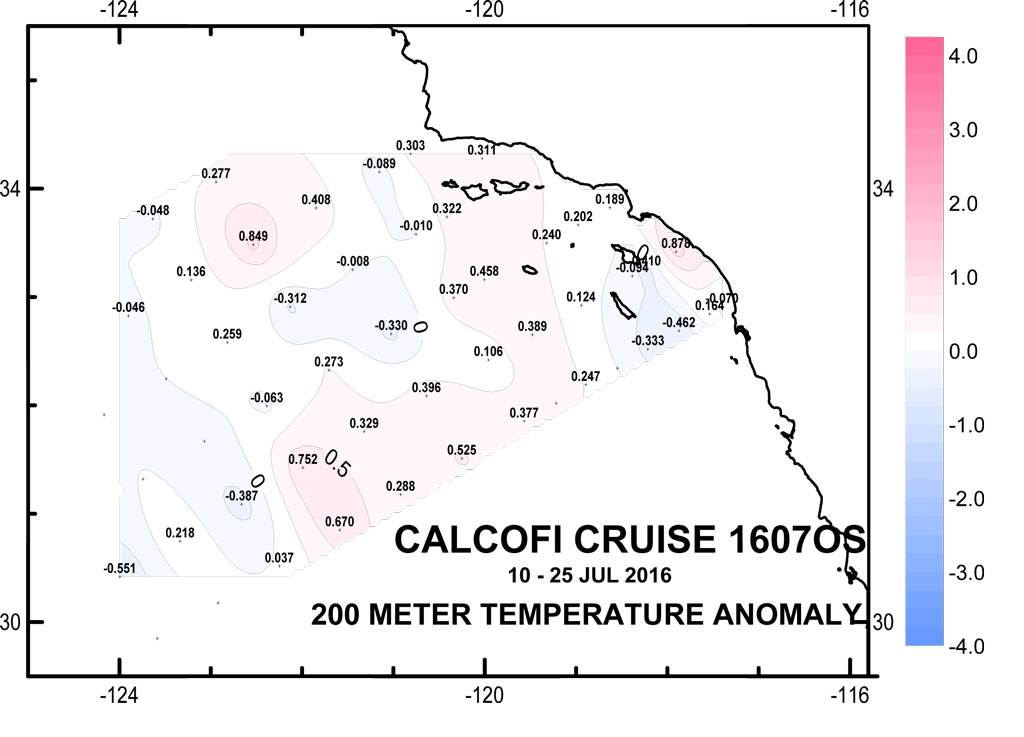
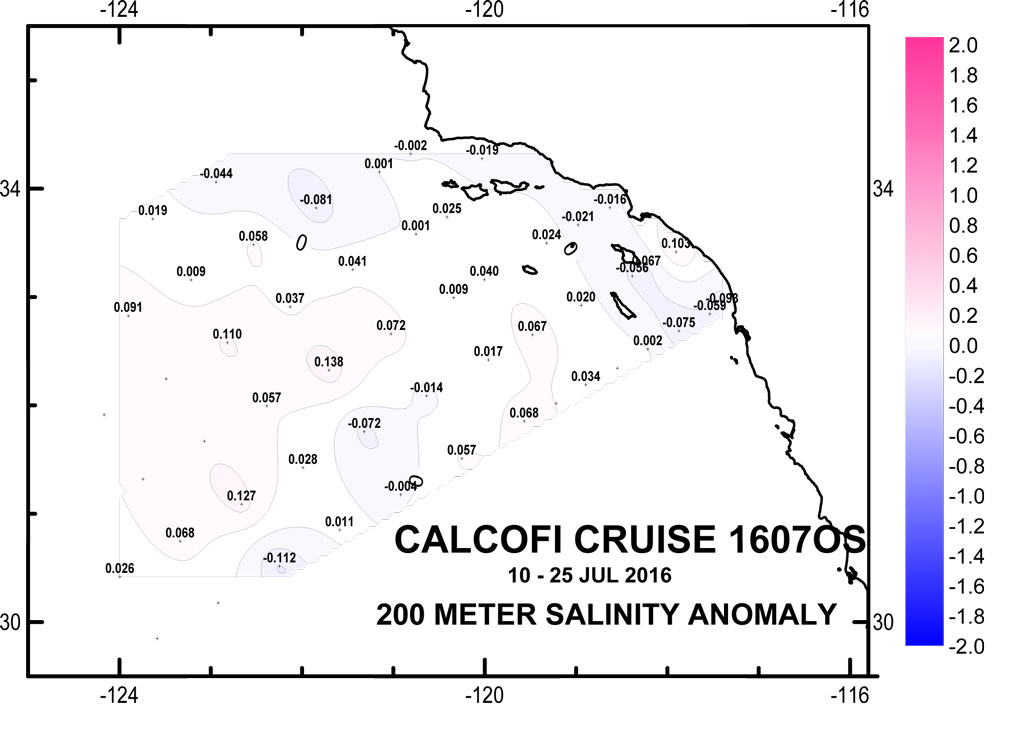
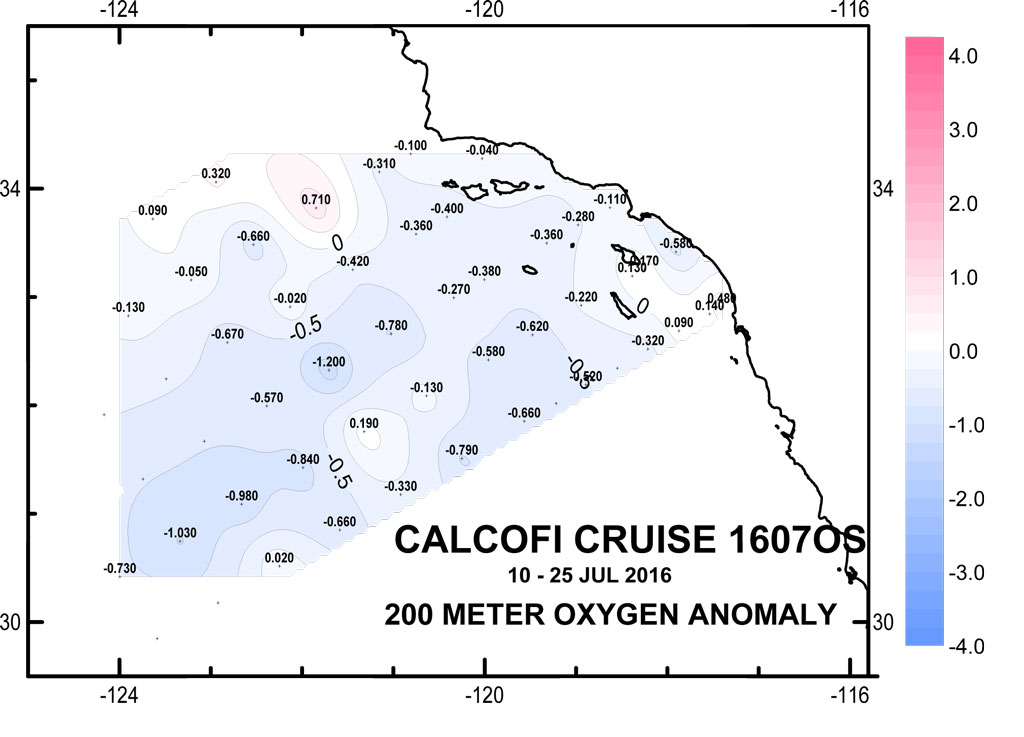
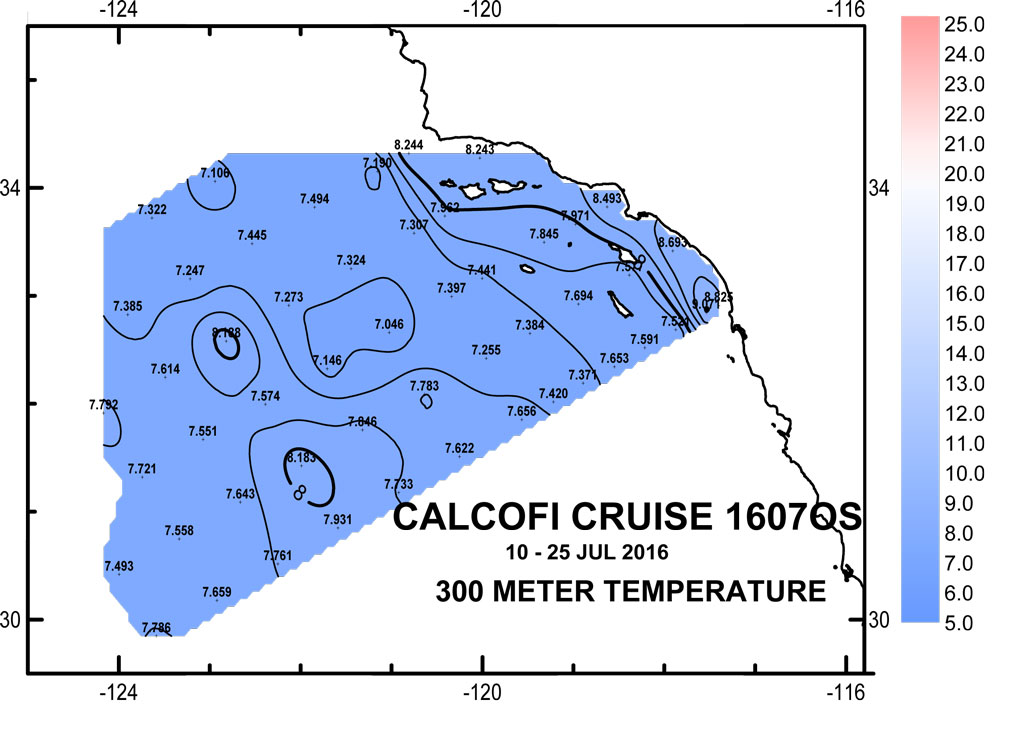
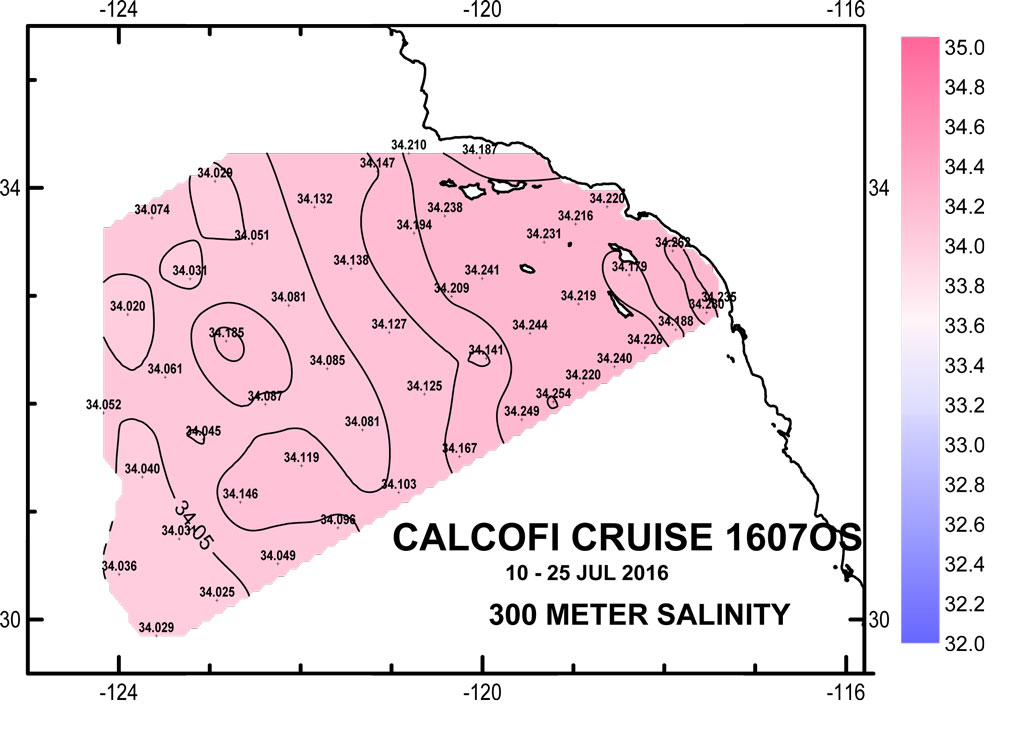
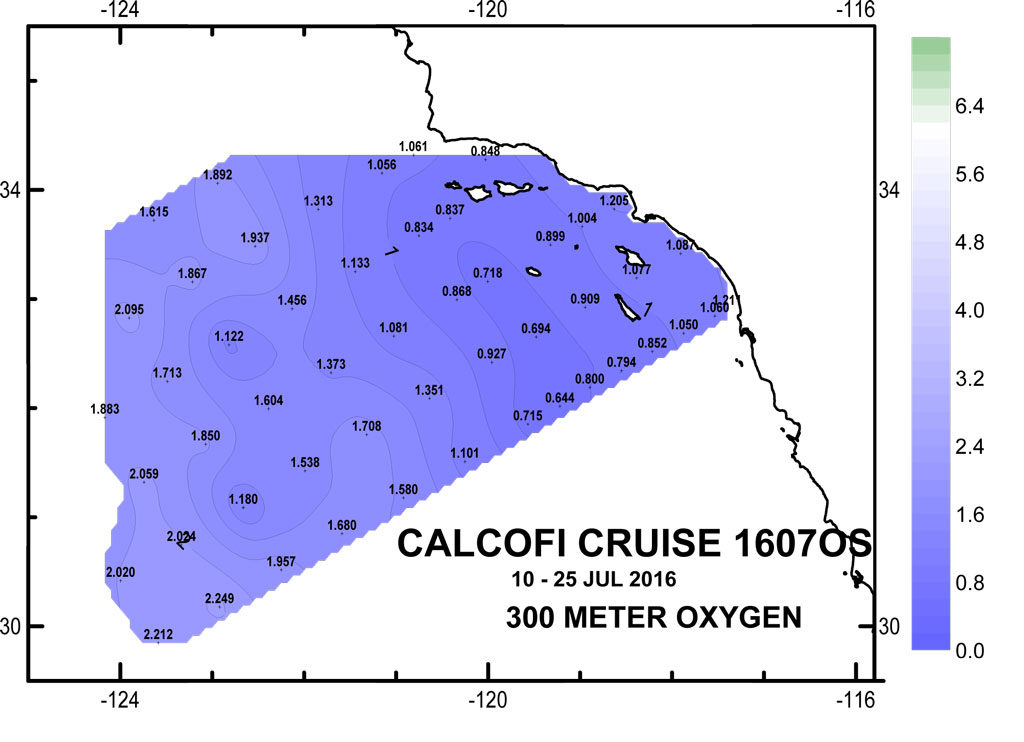
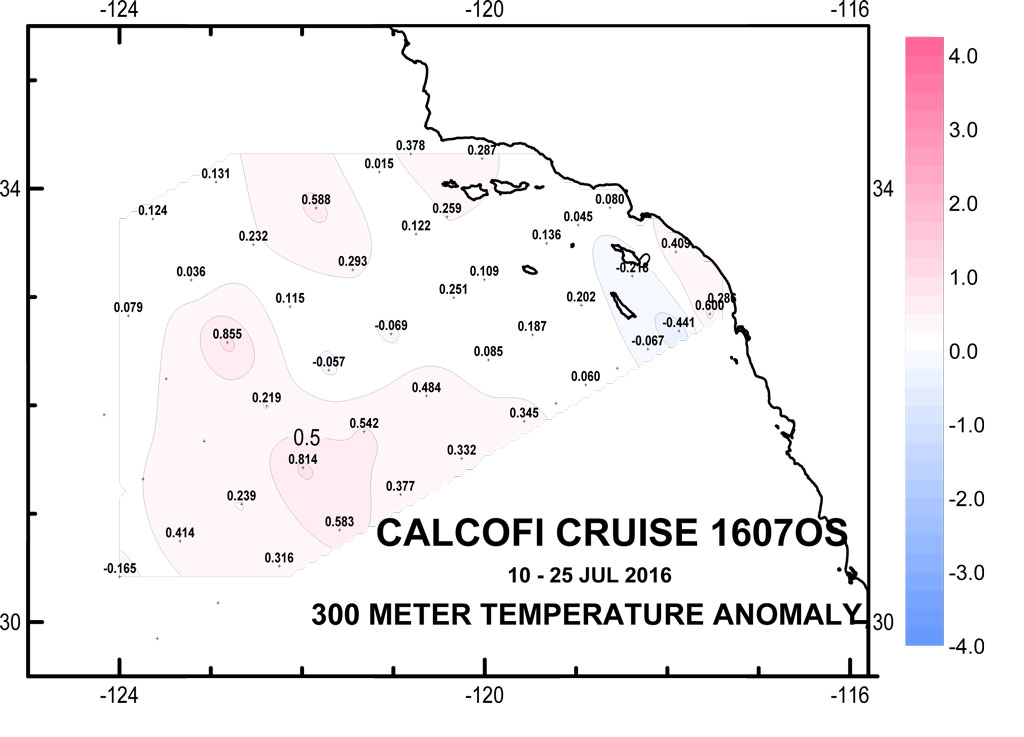
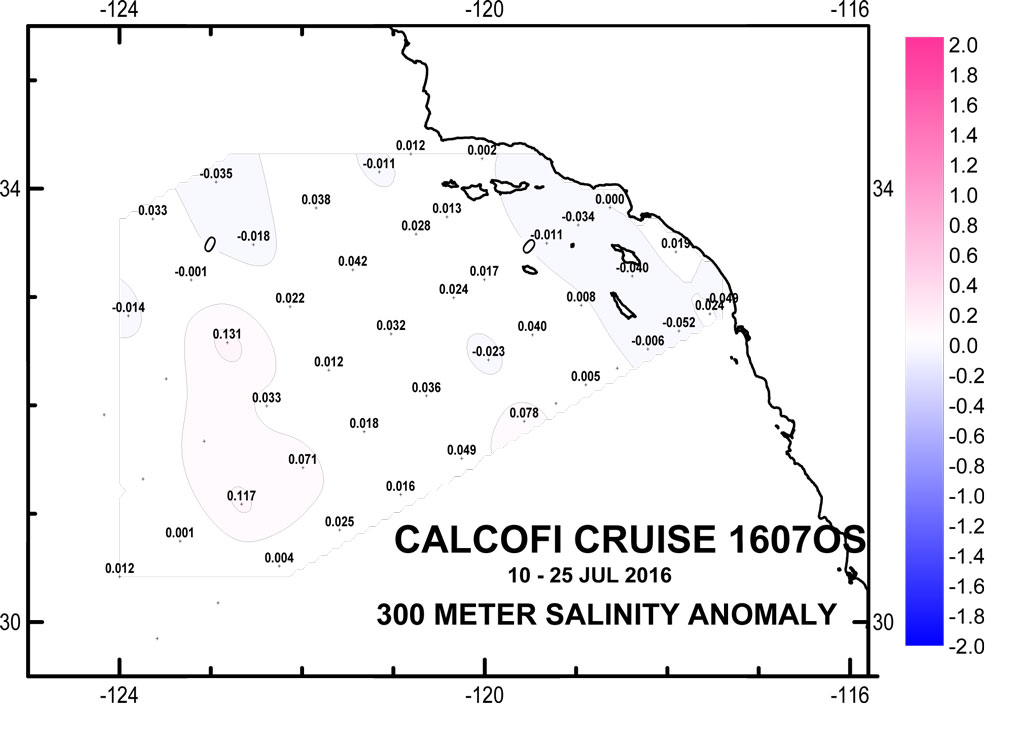
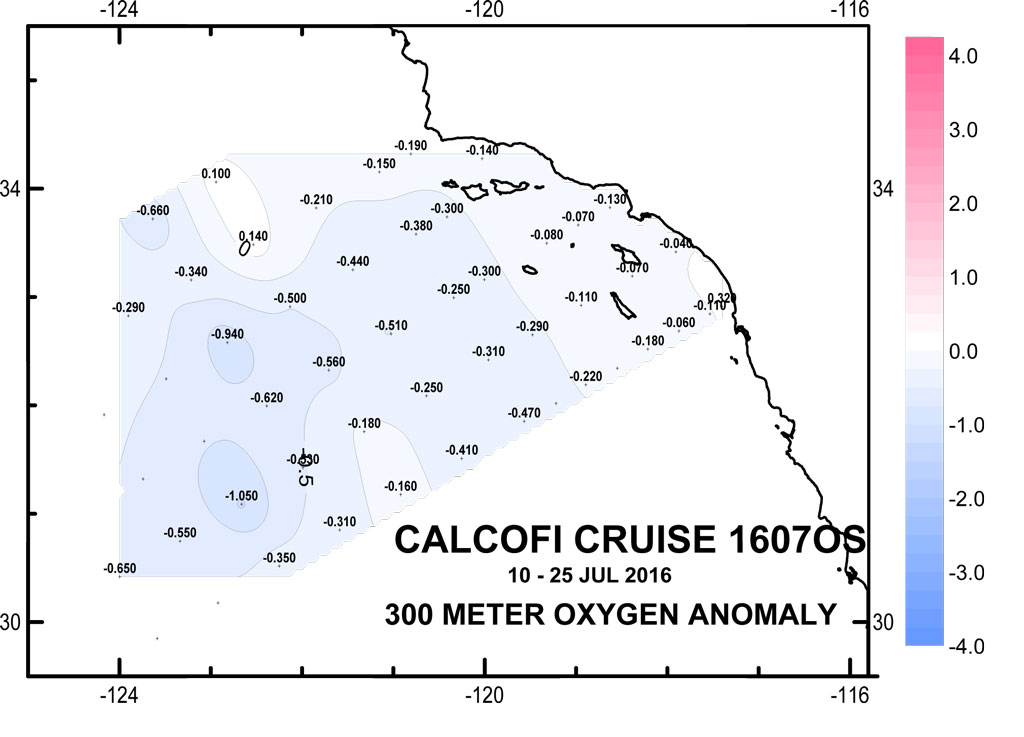
Please note that the anomalies are based on 50-year harmonics (1949-1999) and these data are 1m binavg Seasoft-processed CTD data that have not gone through thorough quality control checks or bottle corrections. They are presented to give a general impression of current conditions. Final data plots will be published after all data are processed. Please note that these plots are missing stations 80.80 & 80.70 due to bad weather. Anomaly data are not available on stations north of line 76.7 since they are typically only occupied on the Winter and Spring cruises, inconsistently.
| 10 & 100 meter Preliminary CTD Data & Anomaly (50yr mean) Contours (Click for larger image) | ||
 |
 |
 |
 |
 |
 |
 |
 |
 |
 |
 |
 |
 |
 |
 |
| 200 meters (Click for larger image) | ||
 |
 |
 |
 |
 |
 |
| 300 meter (Click for larger image) | ||
 |
 |
 |
 |
 |
 |
Final Project Instructions (PDF)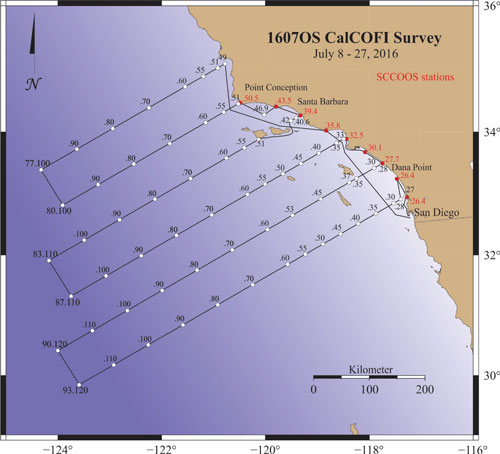
Date Submitted: June 27, 2016
Platform: R/V Ocean Starr
Project Number: 1607OS
Project Title: CalCOFI Survey, Fisheries Resources Division.
Project Dates: July 8, 2016 to July 27, 2016
Prepared by: Amy E. Hays Chief Scientist
Dated: June 24, 2016
I. Overview
- Brief Summary and Project Period: Survey the distributions and abundances of pelagic fish stocks, their prey, and their biotic and abiotic environments in the area of the California Current between San Diego, California and Avila Beach, California during the period of July 8 to 27, 2016.
- Operating Area: From San Diego, CA to Avila Beach, CA and out 300 nautical miles. Please refer to appendix 1.b.
-
Summary of Objectives: Survey the distributions and abundances of pelagic fish stocks, their prey, and their biotic and abiotic environments in the area of the California Current between San Diego, California and Avila Beach, California.
- I.C.1. Continuously sample pelagic fish eggs using the Continuous Underway Fish Egg Sampler (CUFES). The data will be used to estimate the distributions and abundances of spawning hake, anchovy, mackerel, and spawning Pacific sardine.
- I.C.2. Continuously sample multi-frequency acoustic backscatter using the Simrad EK60. The data will be used to estimate the distributions and abundances of coastal pelagic fishes (e.g., sardine, anchovy, and mackerel), and krill species.
- I.C.3. Continuously sample sea-surface temperature, salinity, and chlorophyll-a using a thermosalinometer. These data will be used to estimate the physical oceanographic habitats for target species.
- I.C.4. Continuously sample air temperature, barometric pressure, and wind speed and direction using an integrated weather station.
- I.C.5. Sample profiles of seawater temperature, salinity, chlorophyll-a, nutrients, and phytoplankton using a CTD with water-sampling rosette and other instruments at prescribed stations. Measurements of extracted chlorophyll and phaeophytin will be obtained with a fluorometer. Primary production will be measured as C14 uptake in a six hour in situ incubation. Nutrients will be measured with an auto-analyzer. These data will be used to estimate primary productivity and the biotic and abiotic habitats for target species.
- I.C.6. Sample the light intensity in the photic zone using a standard secchi disk once per day in conjunction with a daytime CTD station. These data will be used to interpret the measurements of primary production.
- I.C.7. Sample plankton using a CalBOBL (CalCOFI Bongo Oblique) at prescribed stations. These data will be used to estimate the distributions and abundances of ichthyoplankton and zooplankton species.
- I.C.8. Sample plankton using a Manta (neuston) net at prescribed stations. These data will be used to estimate the distributions and abundances of ichthyoplankton species.
- I.C.9. Sample the vertically integrated abundance of fish eggs using a Pairovet net at prescribed stations. These data will be used to quantify the abundances and distributions of fish eggs.
- I.C.10. Sample plankton using a PRPOOS (Planktonic Rate Processes in Oligotrophic Ocean Systems net) at all prescribed CalCOFI stations on lines 90.0, 86.7, 83.3 and 80.0 only. These data will be used in analyses by the LTER (Long Term Ecological Research) project.
- I.C.11. Continuously observe, during daylight hours, seabirds and mammals. These data will be used to estimate the distributions and abundances of seabirds and marine mammals.
-
Participating Institutions
- I.D.1 Southwest Fisheries Science Center (SWFSC)
- I.D.2 Scripps Institution of Oceanography (SIO)
- I.D.3 Farallon Institute Advanced Ecosystem Research (FIAER)
- Personnel/Science Party: name, title, gender, affiliation, and nationality
-
Administrative
-
Points of Contacts:
- Chief Scientist/alternate: Amy Hays/Bryan Overcash (858-546-7130/ 858-546-7126); 8901 La Jolla Shores Drive, La Jolla, CA, 92037 (This email address is being protected from spambots. You need JavaScript enabled to view it./Bryan This email address is being protected from spambots. You need JavaScript enabled to view it.)
- Project Operation Lead: Sam McClatchie (858-546-7183); 8901 La Jolla Shores Drive, La Jolla, CA, 92037 (This email address is being protected from spambots. You need JavaScript enabled to view it.)
- Diplomatic Clearances: N/A
-
Licenses and Permits
- All marine mammal work is covered under a federal research permit NMFS Permit 727-1915 issued to Dr. John Hildebrand of SIO.
- CDFW ON April 2, 2015 to NOAA-SWFSC-FRD-Cisco Werner (SC- 12372)
-
Points of Contacts:
II. Operations
-
Project Itinerary
- July 8: Arrive San Diego, CA
- July 8-9: Load scientific gear (10th Avenue Marine Terminal NOAA dock)
- Leg I: July 10: Depart San Diego, CA
- July 27: Arrive San Diego, CA (offload, 10th Avenue Marine Terminal NOAA dock)
-
Staging and De-staging
- Staging for CalCOFI requires two full days. Final de-staging will be conducted in San Diego, CA (10th Avenue Marine Terminal NOAA dock).
- We request 1 laboratory van to be craned onto the afterdeck and secured in San Diego prior to departure. The dimension of the van is approximately 8x10x8 feet weighing 6500 lbs. Power requirement is 110V.
- We request 1 electric winch to be craned onto the afterdeck and secured in San Diego prior to departure. The dimension of the winch is 4.5x4.5 feet. Power requirement is 440V 3-phase.
-
Operations to be Conducted
-
II.B.1. Underway Operations
- II.B.1.a. Thermosalinometer sampling - The SWFSC will provide and maintain a thermosalinometer (TSG), which is calibrated and in working order, for continuous measurement of surface water temperature and salinity.
- II.B.1.b. Acoustics: Calibration of the Simrad EK60 echosounders was performed at the beginning of the charter on June 16 off Newport, OR. No further calibrations are planned. Throughout the cruise, the EK60 echosounders will be operated at 38, 70, 120 and 200 kHz and interfaced to a data acquisition system to estimate small pelagic fish and krill biomasses between 10 and 750 m. An EK60 Adaptive Logging program (EAL) will be run continuously to detect the seabed depth and optimize the logging range while avoiding aliased seabed echoes (“false bottoms”). The vessel's depth sounder and Doppler current meter may be used minimally at the discretion of the Captain, but will normally remain off while underway. During daytime transit between stations, the ship will maintain a desired speed of 10 knots. The ship shall inform the Cruise Leader of any use of the vessel's sounders, as it interferes with the signals received on the EK60s that will be used continuously.
- II.B.1.c. CUFES: The egg pump will be mounted inside the ship’s hull drawing water from a depth of three meters. The pump will run continuously between stations to sample any pelagic fish eggs. Approximately 640 liters/minute is sent through a concentrator which filters all material larger than 505µm. The sieved material is then collected and identified. All fish eggs are identified to lowest taxa, counted and entered into the data acquisition software. Each sample entry is coupled with sea surface temperature, geographical position, date and time, and surface salinity. Sampling intervals will vary in length, depending on the number of fish eggs seen, from five to 30 minutes.It is requested that prior to departure from Ballard, WA that the CUFES intake be cleared from all marine growth.It is requested that prior to departure from Ballard, WA that the hull be cleaned of all barnacles and other bio-fouling organisms that will impede the acoustic calibration operations.
- II.B.1.d. Bird Observations: During daylight hours a bird observer will be posted on the flying bridge to identify and count birds while the ship is underway during cruise transects.
- II.B.1.e. Acoustic hydrophone: During transit between most daylight stations, an acoustic hydrophone array will be towed from the stern at a distance of 300 meters with a deck loaded winch to record sounds from marine mammals. The winch is 440V 3-phase with a deck pattern of 4.5 by 4.5 feet. Upon approaching a station, two sonobuoys will be deployed one nautical mile prior to stopping for station work.
-
II.B.2. Station Operations: Each standard station will include the following:
- II.B.2.a. CTD/Rosette consisting of 24 10-liter hydrographic bottles will be lowered to approximately 500 meters (depth permitting) at each station to measure physical parameters and collect water at discrete depths for analysis of: salinity, nutrients, oxygen, chlorophyll, etc. It is requested that the hydraulic hoist on the port side trolley way be installed and operational.
- II.B.2.b. CalBOBL (CalCOFI Bongo Oblique): standard oblique plankton tow with 300 meters of wire out, depth permitting, using paired 505 µm mesh nets with 71 cm diameter openings. The technical requirements for this tow are: Descent wire rate of 50 meters per minute and an ascent wire rate of 20 meters per minute. All tows with ascending wire angles lower than 38° or higher than 51° in the final 100 meters of wire will be repeated. Additionally, a 45° wire angle should be closely maintained during the ascent and descent of the net frame. The port side sample will be preserved in buffered ethanol at every station.
- II.B.2.c. Manta net (neuston) tow: using a 505 µm mesh net on a frame with a mouth area of 0.1333 m². Tows are 15 minutes in duration at towing speed of approximately 1.5 - 2.0 knots. Wire angles should be kept between 15° and 25°.
- II.B.2.d. Pairovet net: will be fished from 70 meters to the surface (depth permitting) using paired 25 cm diameter 150 µm mesh nets at all stations out to and including station 70.0. The technical requirements for Pairovet tows are: Descent rate of 70 meters per minute, a terminal depth time of 10 seconds and an ascent rate of 70 meters per minute. All tows with wire angles exceeding 15° during the ascent will be repeated.
- II.B.2.e. A PRPOOS (Planktonic Rate Processes in Oligotrophic Ocean Systems) net will be taken on specific stations on line 90.0, 86.7, 83.3, and 80.0. These stations are occupied as part of the LTER (Long Term Ecological Research) project. The mesh of the PRPOOS net is 202 µm and the tow is a vertical cast up from 210 meters. The technical requirements for the PRPOOS tows are: Decent rate of 40 meters per minute, a terminal depth time of 20 seconds and an ascent rate of 50 meters per minute.
- II.B.2.f. Primary productivity: at about 1100 hours on each day a primary productivity CTD cast consisting of six 10-liter hydrographic bottles (mounted on CTD frame) will be carried out. The cast arrangement will be determined by a Secchi disc observation. This cast will be in conjunction with an already scheduled station. The purpose of the cast is to collect water from six discrete depths for daily in situ productivity experiments. Measurements of extracted chlorophyll and phaeophytin will be obtained with a fluorometer. Primary production will be measured as C14 uptake in a six hour in situ incubation. Nutrients will be measured with an auto-analyzer. All radioisotope work areas will be given a wipe test before the departure of the SIO technical staff.
- II.B.2.g. A light meter (Secchi disk) will be used to measure the light intensity in the euphotic zone once a day with the primary productivity cast and all daytime stations.
- II.B.2.h. Weather observations.
-
II.B.3.a. Order of Operations for each standard station:
- CTD to 515 meters with 24 bottle rosette (depth permitting).
- Secchi disk (daylight stations only, Secchi will be first prior to CTD on Primary Productivity station of the day which is typically 0900-1100).
- PRPOOS net tow (lines 90.0, 86.7, 83.3 and 80.0 only).
- Pairovet net tow (on all lines out to station 70.0 but not to include near shore SCCOOS).
- Manta net tow (on all stations except for near shore SCCOOS and stations after line 76.7).
- Bongo net tow (on all stations).
- II.B.4.a. Plankton Nets, Oceanographic Sampling Devices, Video Camera and ROV Deployments: The SWFSC deploys a wide variety of gear to sample the marine environment during all of their research cruises. These types of gear are not considered to pose any risk to protected species and are therefore not subject to specific mitigation measures. However, the OOD and crew monitor for any unusual circumstances that may arise at a sampling site and use their professional judgment and discretion to avoid any potential risks to protected species during deployment of all research equipment.
- Marine mammal watches are now a standard part of conducting fisheries research activities, particularly those that use gear (e.g., longlines and mid-water trawls) known to interact with marine mammals or that we believe have a reasonable likelihood of doing so in the future. Marine mammal watches are conducted in two ways. First, watches are conducted by lookouts (those navigating the vessel and other crew) at all times when the vessel is being operated. Second, marine mammal watches and monitoring occur for 30 minutes prior to deployment of gear, and they continue until gear is brought back on board, for longlines and mid-water trawl gear. Watches in the first category are not done by dedicated staff; these personnel primary duties as lookout according to the Rules of the Road are “maintaining a proper lookout by sight and hearing as well as by all available means appropriate in the prevailing circumstances and conditions so as to make a full appraisal of the situation and of the risk of collision.” Watches in the second category are done by dedicated scientists with no other responsibilities during the watch period. If marine mammals are sighted within 1 nm of the planned set location then the sampling station is either moved or canceled. Watch-standers record the estimated species and number of animals present and their behaviors. This information can be valuable in understanding whether some species may be attracted to vessels or gear.
-
II.B.4.b. Vessel speeds are restricted on research cruises in part to reduce the risk of ship strikes with marine mammals. Transit speeds vary from 8-11 knots. While underway:
- We will have a bird observer on the flying bridge during all daylight transects.
- We will have 2 marine mammal observers on the flying bridge during all daylight transects.
- We will have a marine mammal acoustician with a towed hydrophone. The hydrophone will be towed off the stern at a distance of 300 meters between daylight stations. The hydrophone will be deployed at a ship speed of 5 knots while leaving a station. Once deployed, ship can travel at full speed. The hydrophone can be retrieved at ship’s full speed.
- At 1 mile prior to each daylight station marine mammal observers will deploy 2 sonobuoys. The hydrophone will be retrieved at this time.
- Communication will be open to bridge during all hydrophone deployments and retrievals.
-
II.B.1. Underway Operations
- Conditions which preclude normal operations: In the event of poor weather conditions, we will work with the ship’s officers on developing the best strategy for completion of all stations safely. We have replacement gear for most operations. Equipment failure should not impact our project. Prior to departure, the Chief Scientist will conduct a meeting of the scientific party to train them in sample collection and inform them of project objectives. Some vessel protocols, e.g., meals, watches, etiquette, etc. will be presented by the ship’s Operations Officer.