CalCOFI 1604SH
| Summary: | CalCOFI 1604SH on NOAA RV Bell M Shimada left San Diego 01 April 2016, successfully occupied 101.5 station and offloaded in San Francisco 23 Apr 2016. Sta 60.90 was the "0.5" station since net tows were performed but the CTD-rosette cast was cancelled due to marginal conditions. Navy ops near San Nicolas Island created a westward transit delay so coastal station work on line 83 was performed before stas west of 86.7 35 - refer to the station map for station work & sequence. Later, additional Navy ops required us to move north of line 80 and work stations on line 76.7 before line 80. Unfortunately, the weather got rough as we started line 80 offshore and two important stations, 80.80 and 80.70, were missed due to bad weather. After finishing sta 80.55, completing the 75-sta standard pattern, personnel were dropped off 16 Apr in Santa Barbara. CTD-rosette operations on ther remaining lines, 73.3, 70.0, 66.7, 63.3, & 60.0, were sampled using a 12-bottle rosette, reducing the analytical sample load. RV Shimada came into San Francisco's Pier 30/32 0800 23Apr2016 for packup and offload. Gear and bins were loaded onto trucks 24Apr2016, trucked to San Diego, and offloaded 25Apr2016. |
| Data-related: | 1604SH Preliminary Plots Web Page; 1604SH CTD Preliminary Processing |
| Data Files: | 1604SH FinalQC CTD+Bottle files; 1604SH CTD(raw) Cast files; |
| Cruise Designation: | CalCOFI 1604SH; NOAA Project (OMAO) SH-16-05 |
| Cruise Dates: | Friday, 01 Apr 2016 - Saturday, 23 Apr 2016 |
| Loading: | Monday, 28 Mar 2016 - Tuesday, 29 Mar 2016 |
| Offloading: | 23 - 24 Apr 2016 San Francisco, CA |
| Ship: | NOAA RV Bell M Shimada |
| Cruise Instructions: | NOAA Cruise Instructions PDF |
| Station plan: | 104 Stations (95 CalCOFI + 9 SCCOOS); NOAA 1604SH Project Instructions will be posted here |
| Cruise Map: | 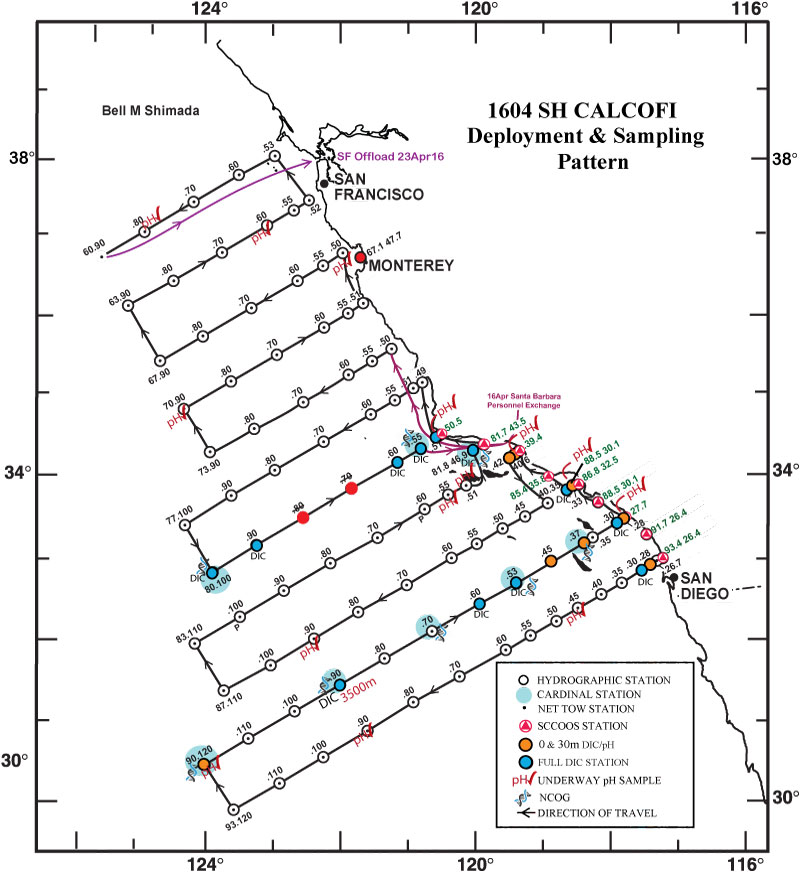 |
| Contacts: | Amy Hays, Chief Scientist, NMFS |
| Jennifer Rodgers-Wolgast, IOD (SIO Technical Coordinator) | |
| CTD Processing Summary CalCOFI 1604SH CTD Final Data | |||
| Download 1604SH CTD raw cast files zipped | Download 1604SH FinalQC CTD + bottle data | ||
| General CTD Notes - data acquisition notes, logistics, processing - see below. Please note that these regressions are generated from CTD vs final bottle data after reprocessing with final bottle data. CTD temperatures and salinities do not usually change but oxygen, estimated chlorophyll-a, estimated nitrate may have changed significantly after point-checking. Questionable or mistrip bottle data are removed from these comparisons and may be visible on the CTD.csv plots but have been flagged with quality codes. For this cruise and future cruises, both primary & secondary sensor profiles vs bottle data will be generated and archived in the downloadable CTD+Bottle data files. These plots are under the "csv-plots\Primary" & "csv-plots\Secondary" subdirectories. |
|||
| CTD sensor corrections derived by comparing CTD sensor data, 4sec average prior to bottle closure, to bottle samples | |||
| Dual T, S, & O2 | Primary Sensor | Secondary Sensor | |
| Salinity offset (bottle - CTD salinity; > 350m only; Seabird SBE4) | -0.0011 | 0.0035 | |
| Oxygen ml/L (dual Seabird SBE43; 2° O2 Calib Off) | y = 1.0435x - 0.0094 R² = 0.9996 |
y = 1.0699x - 0.0124 R² = 0.9984 |
|
| Oxygen umol/Kg (dual Seabird SBE43; 2° O2 Calib Off) | y = 1.045x - 0.3165 R² = 0.9996 |
y = 1.0715x - 0.4439 R² = 0.9984 |
|
| Single sensors | Linear | Polynomial | |
| Nitrate - ISUS 4sec ave voltage vs Bottle Nitrate (Satlantic MBARI-ISUS v2) | y = 30.332x - 1.062 R² = 0.9921 |
||
| Fluorometer - linear & polynomial regressions |
y = 11.175x - 0.4098 R² = 0.829 |
y = 10.116x2 + 6.6184x - 0.1787 R² = 0.8574 |
|
 |
 |
||
 |
 |
||
 |
 |
||
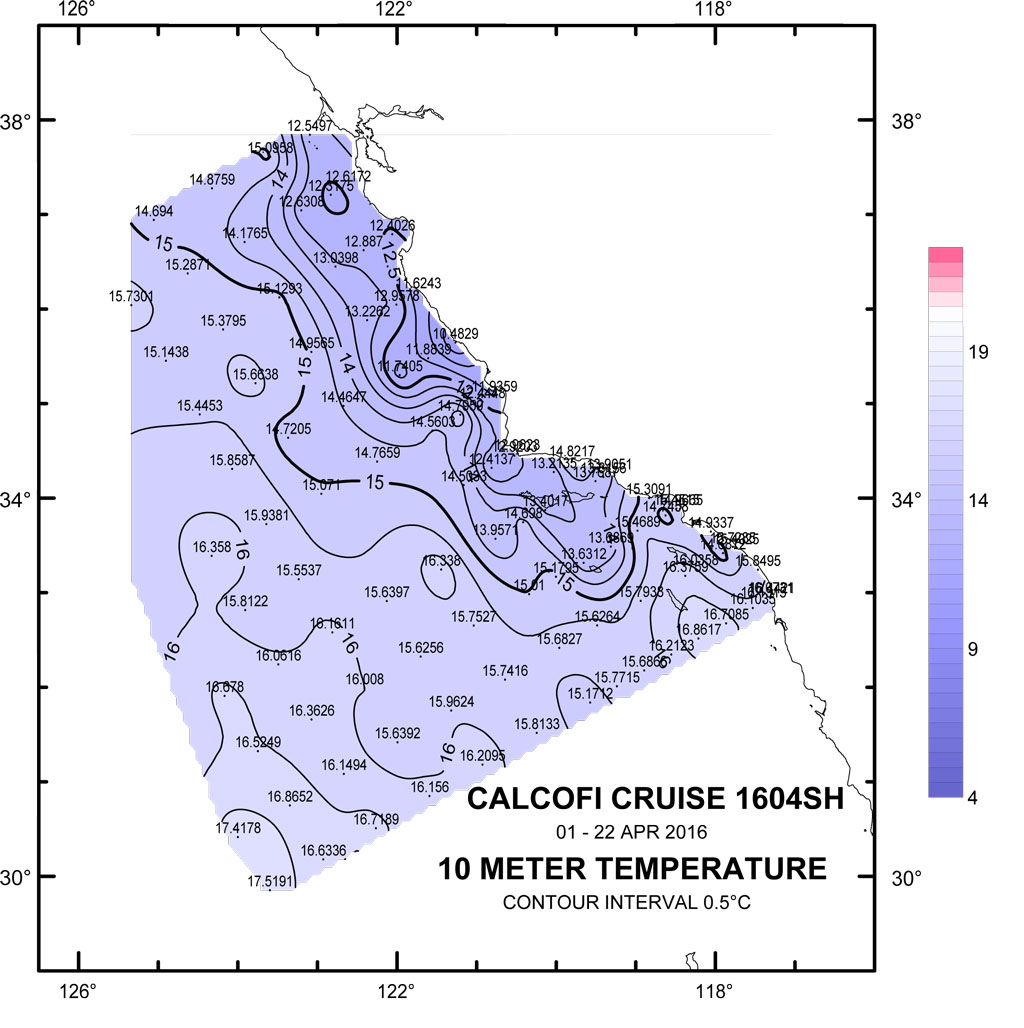
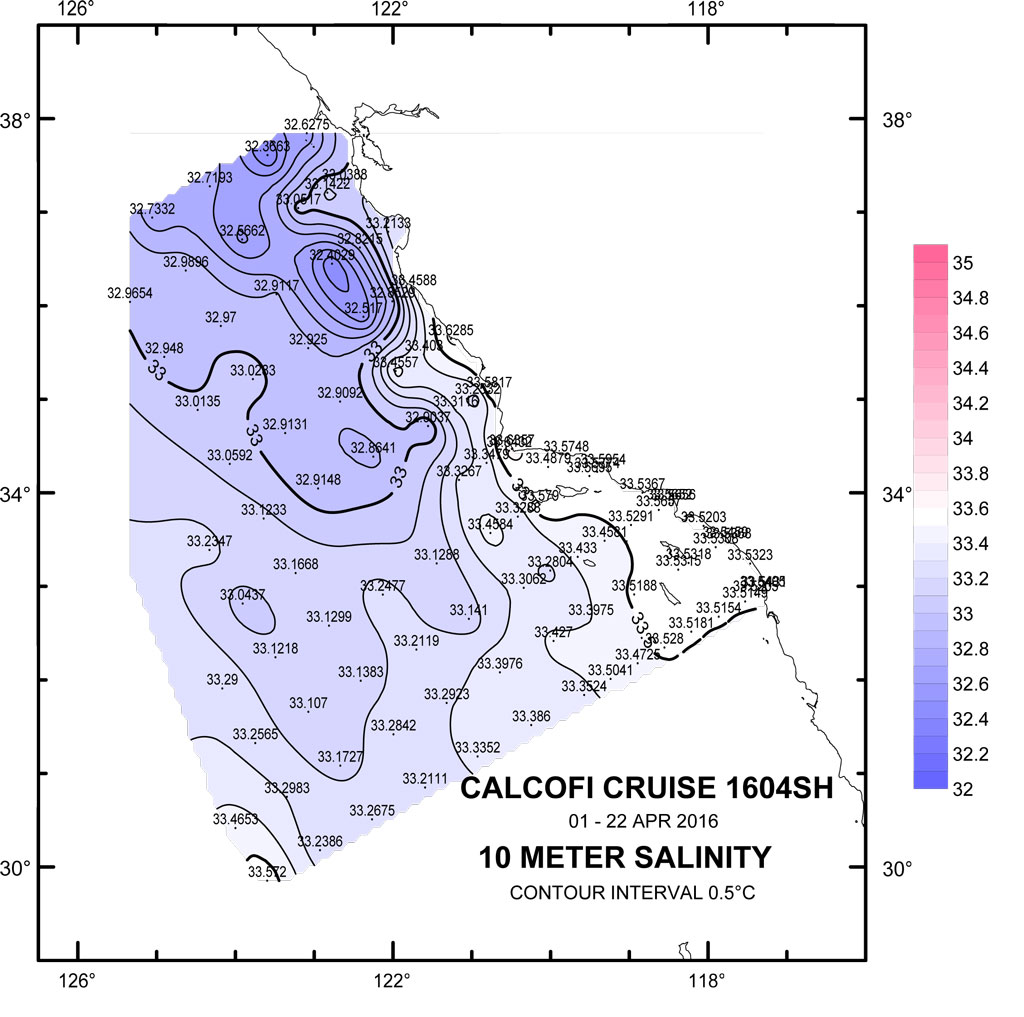
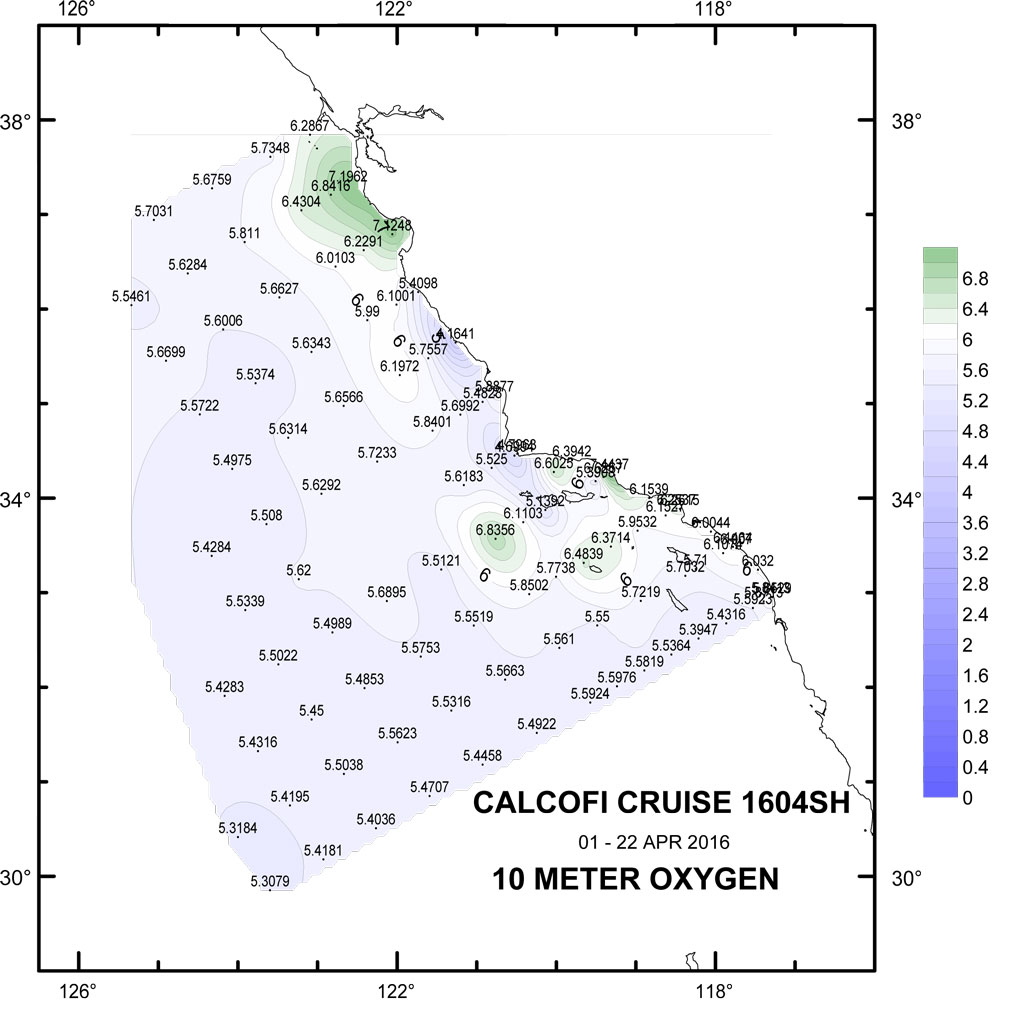
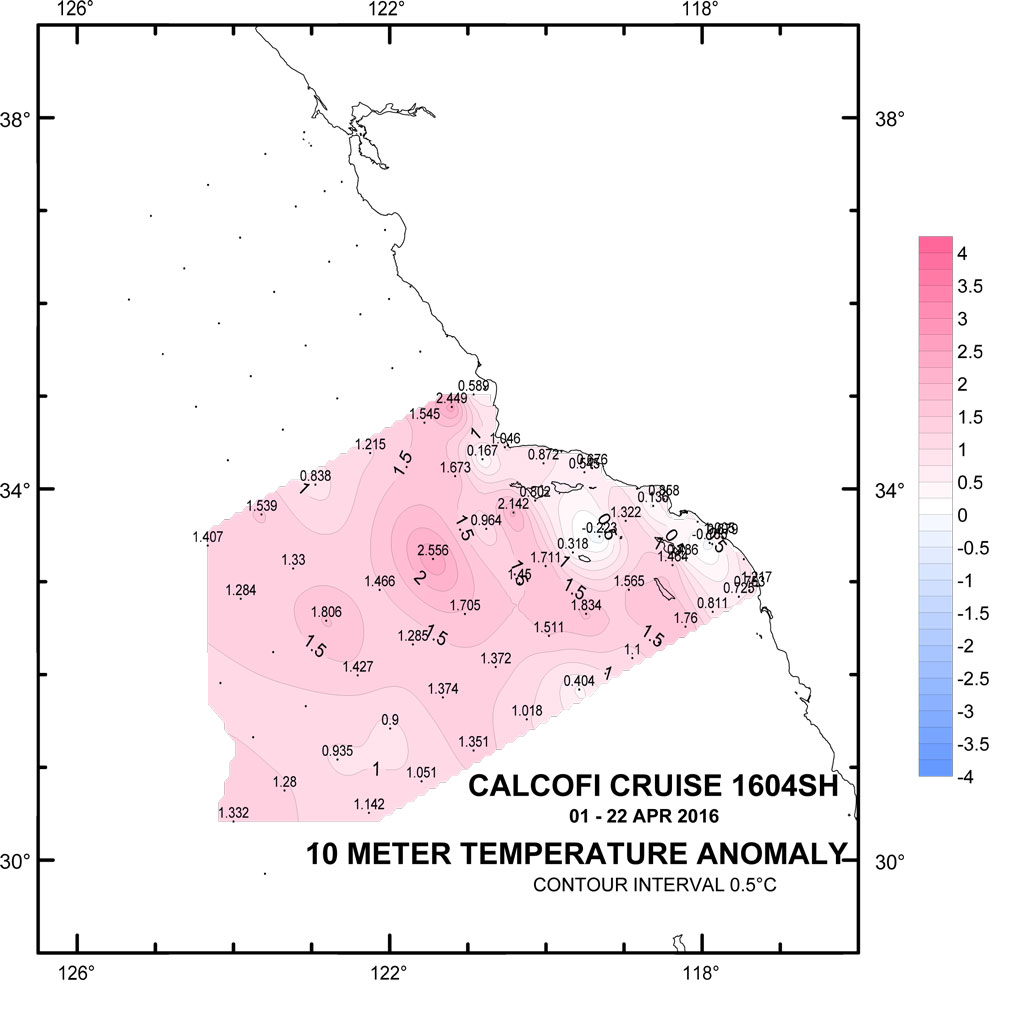
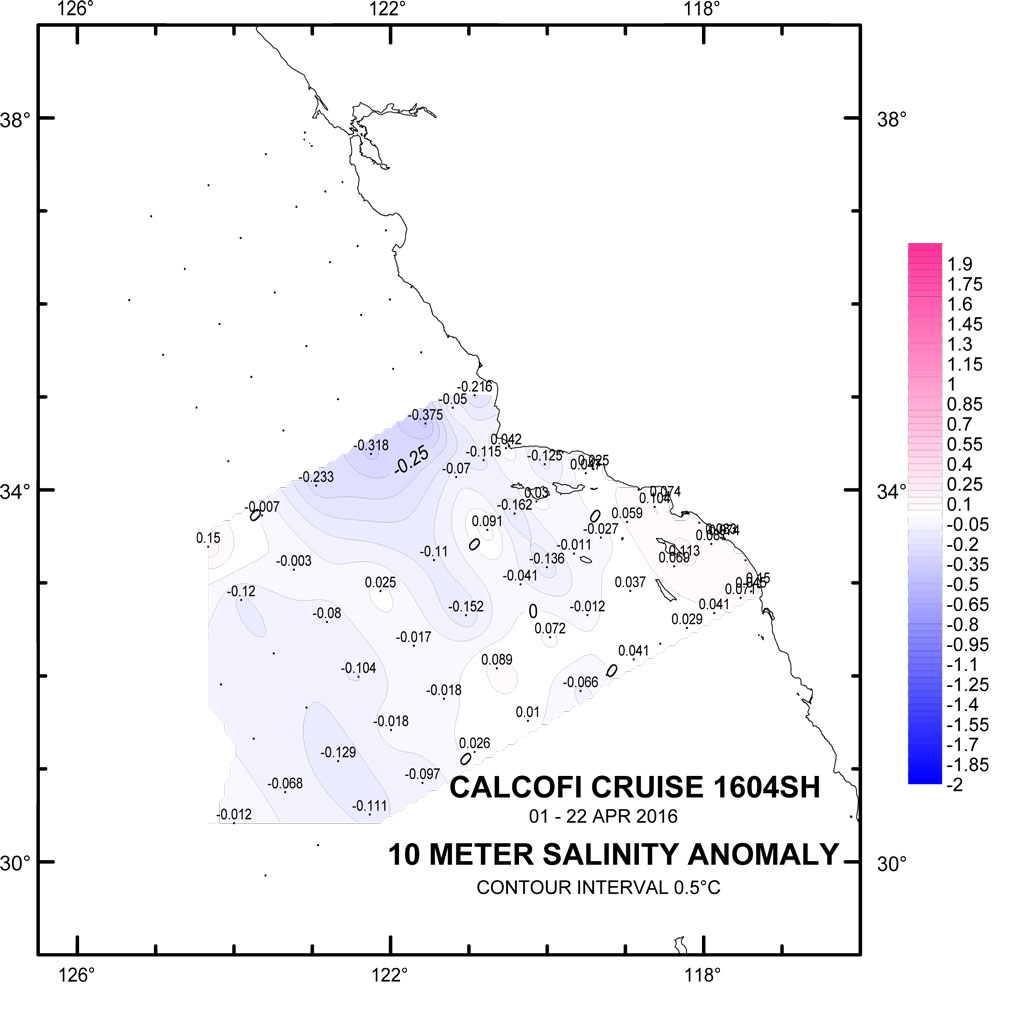
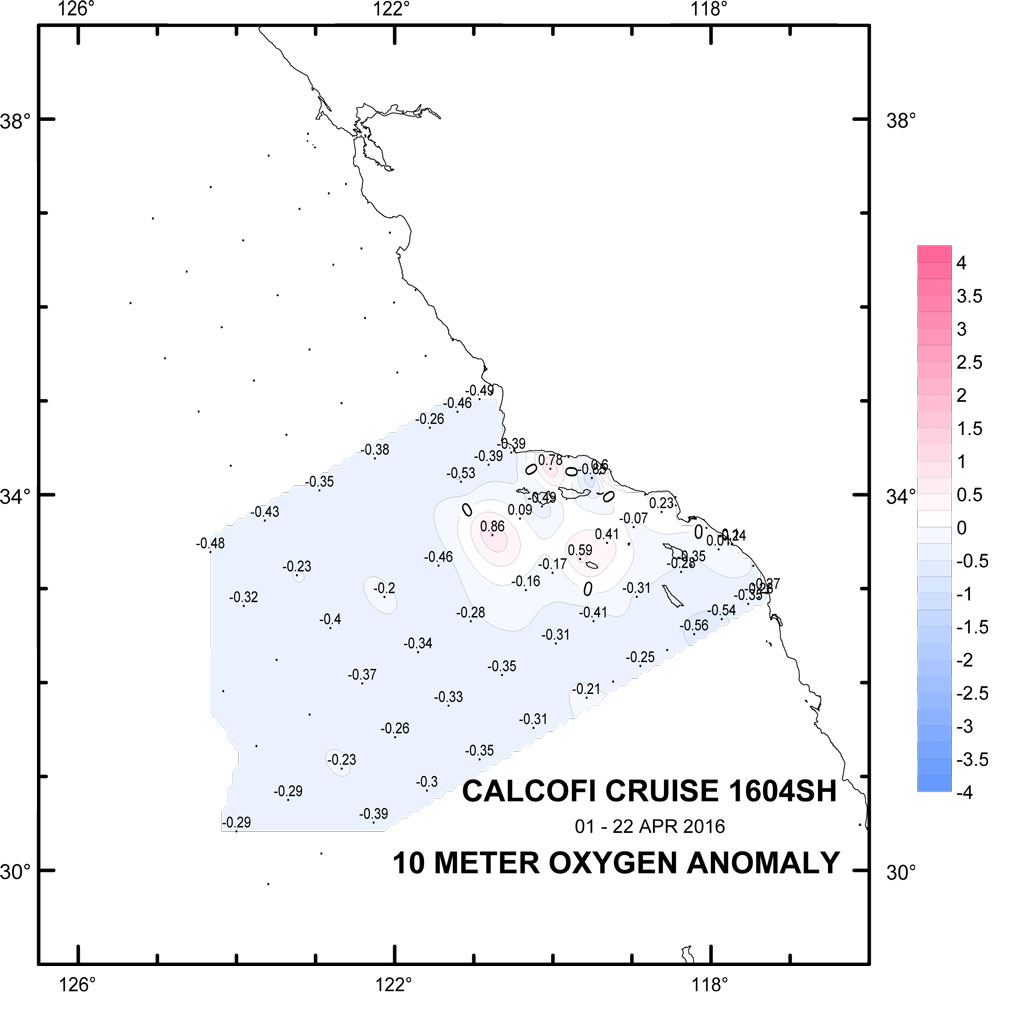
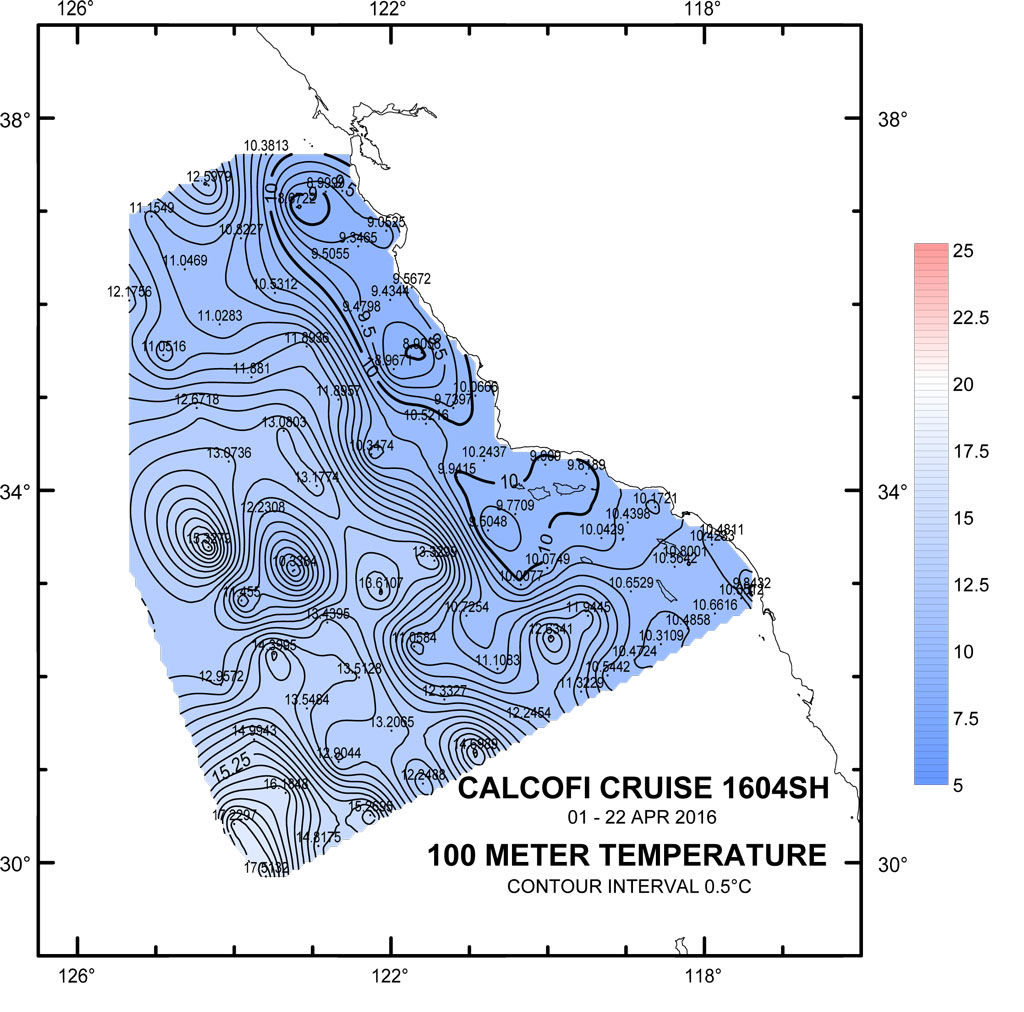
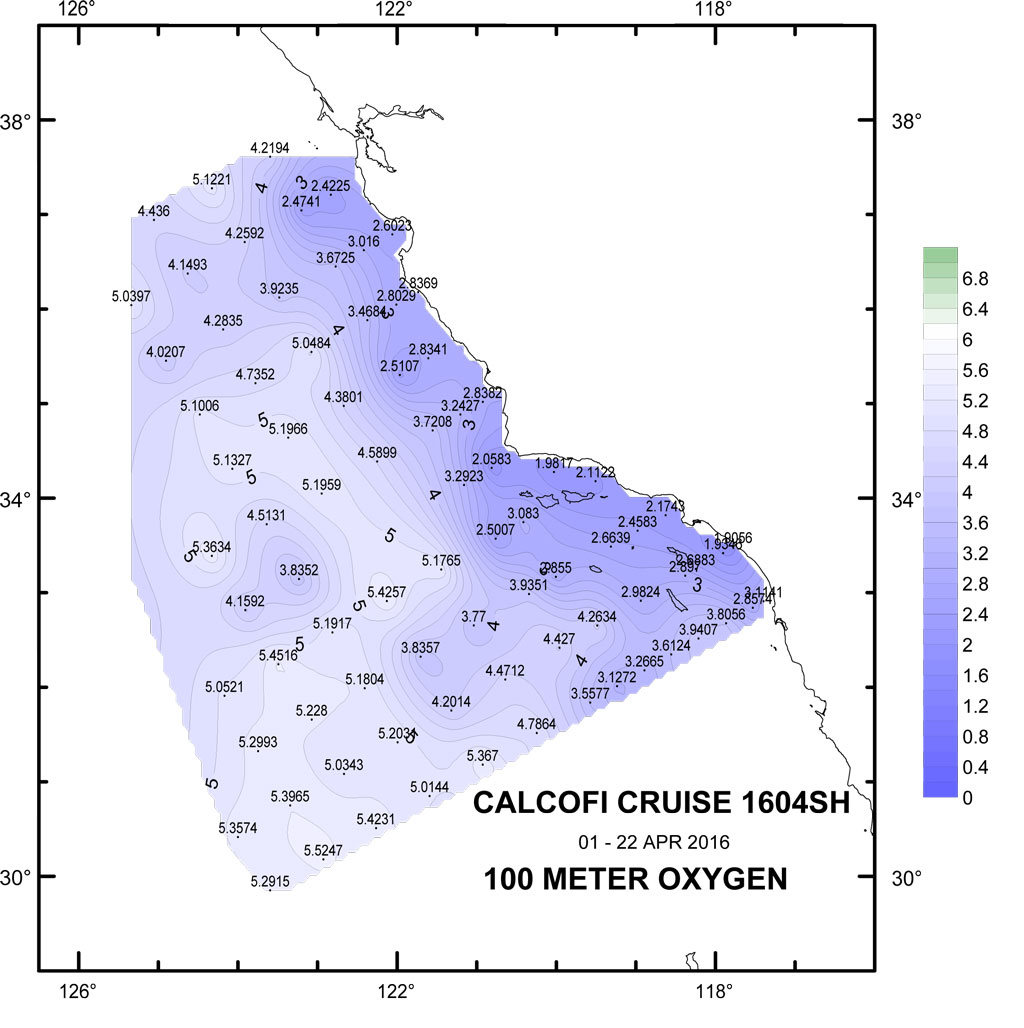
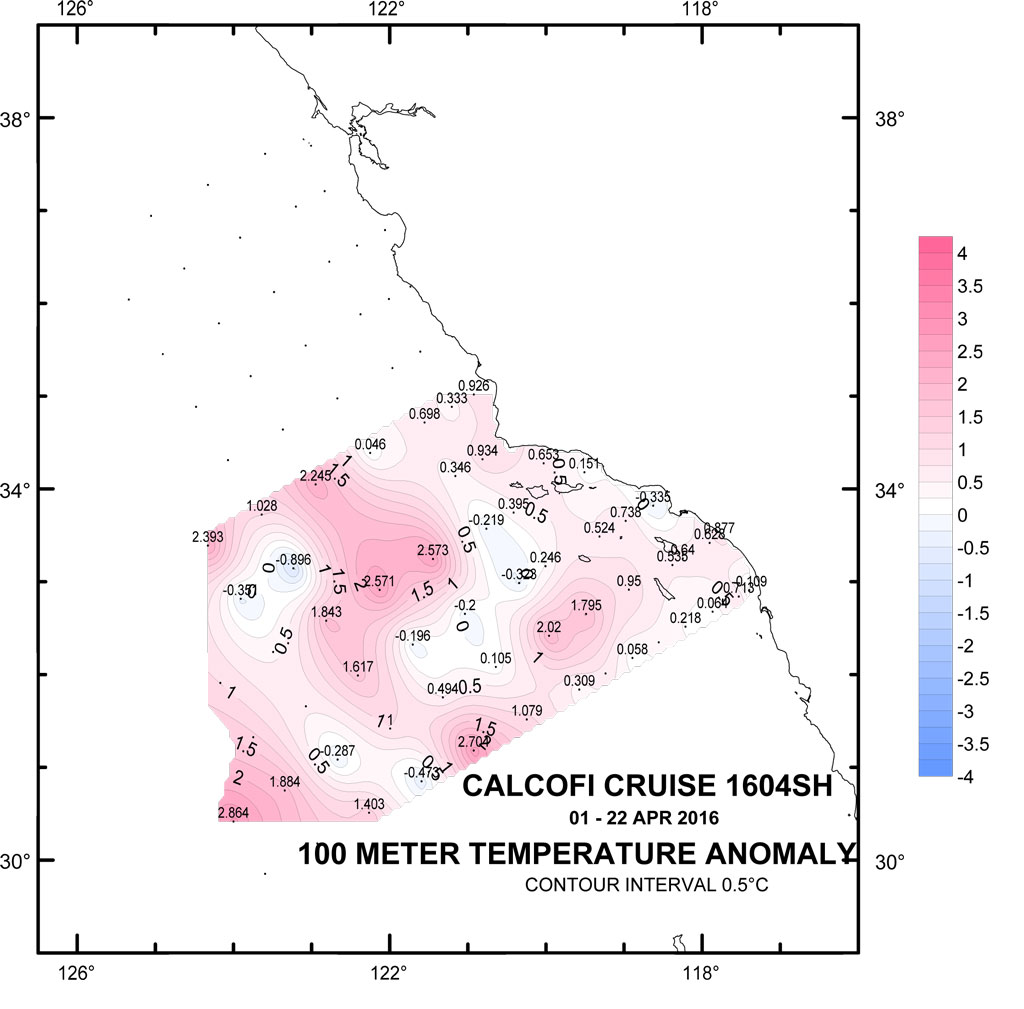
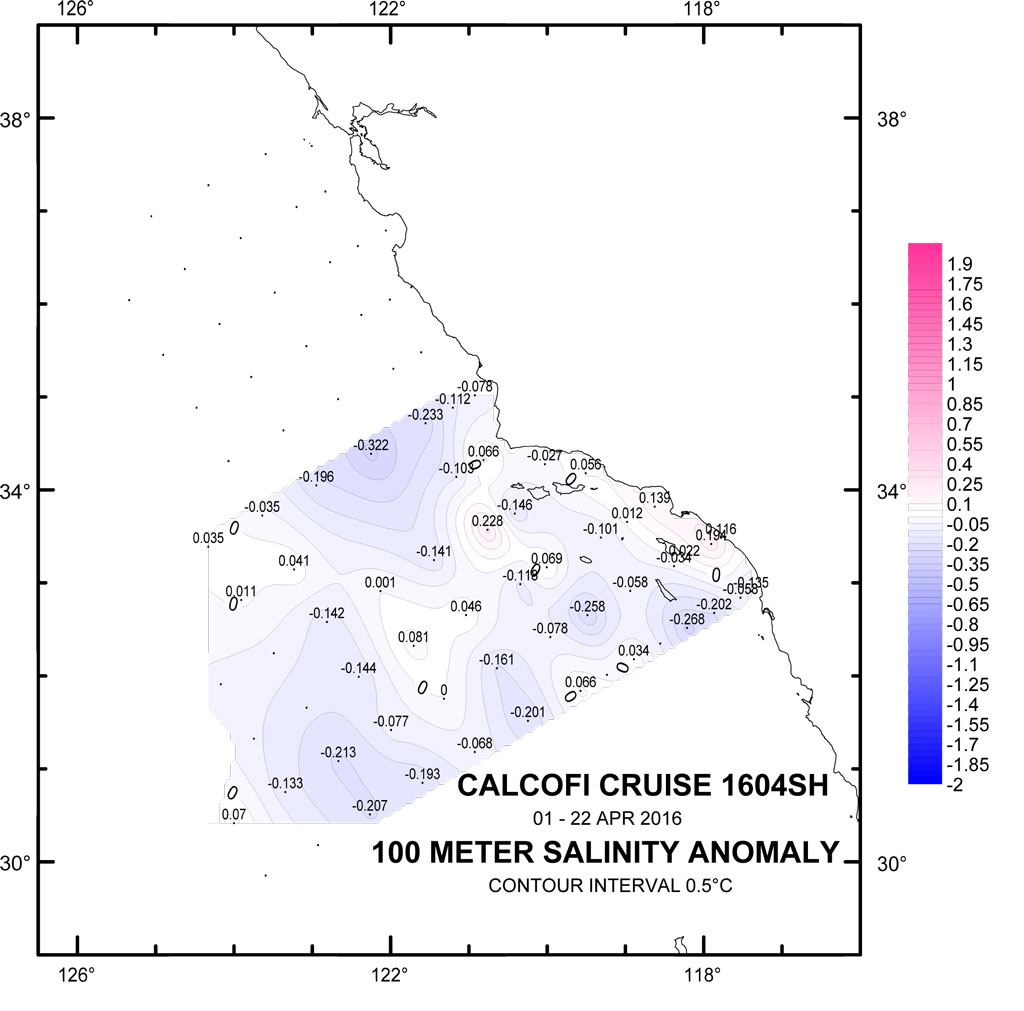
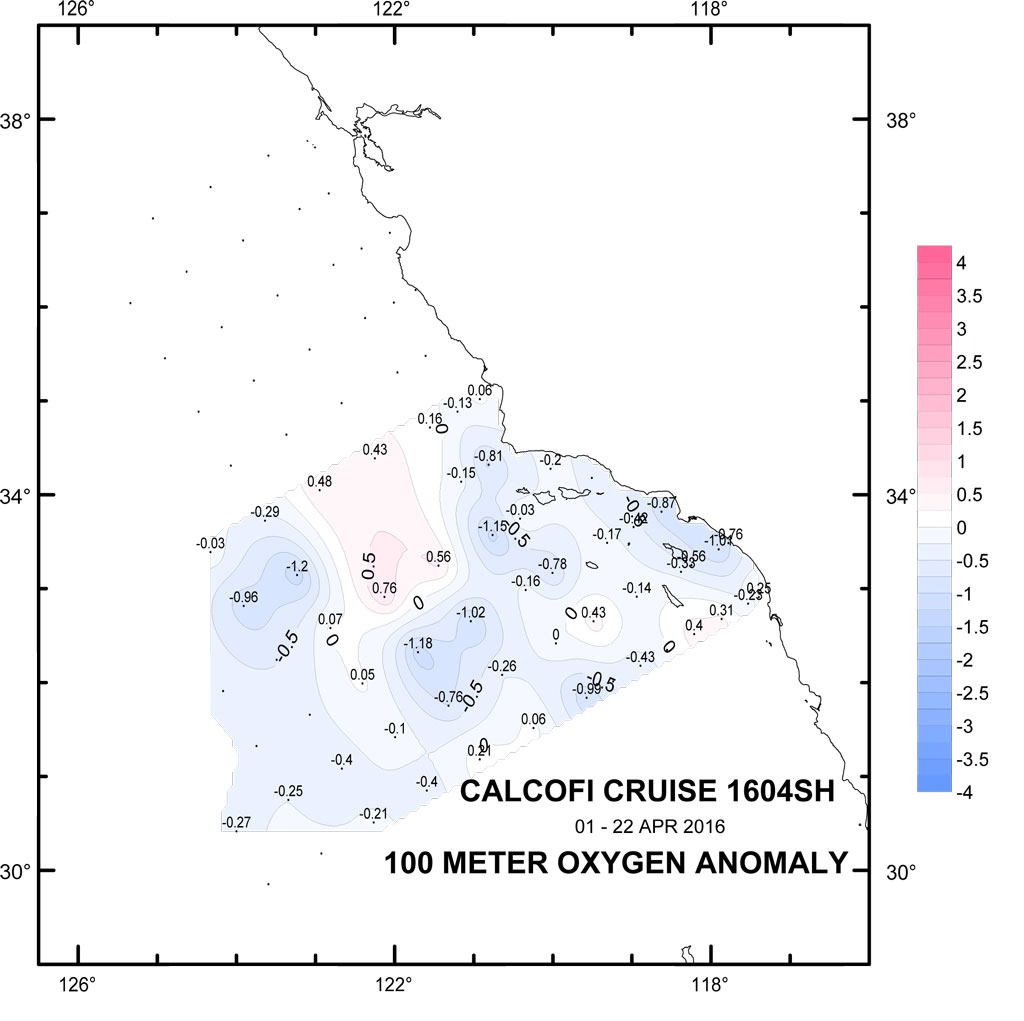
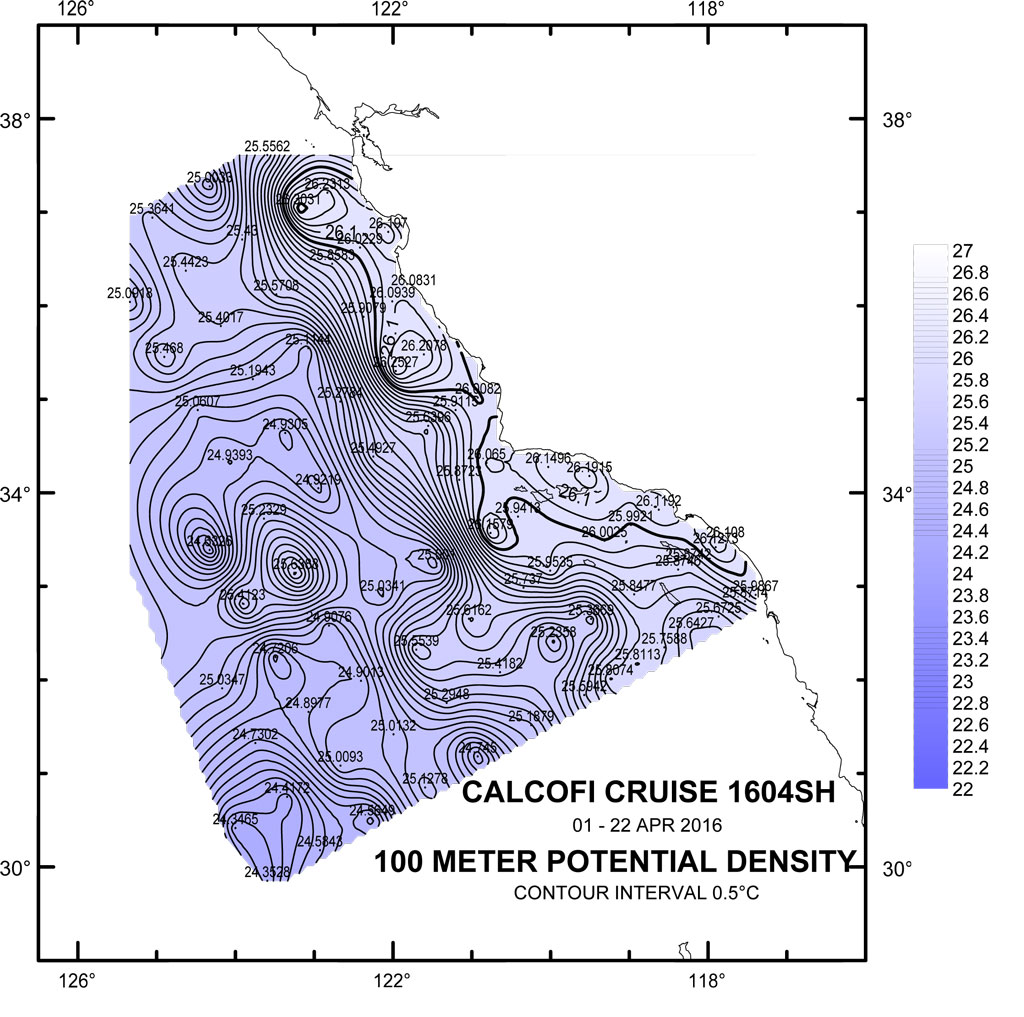
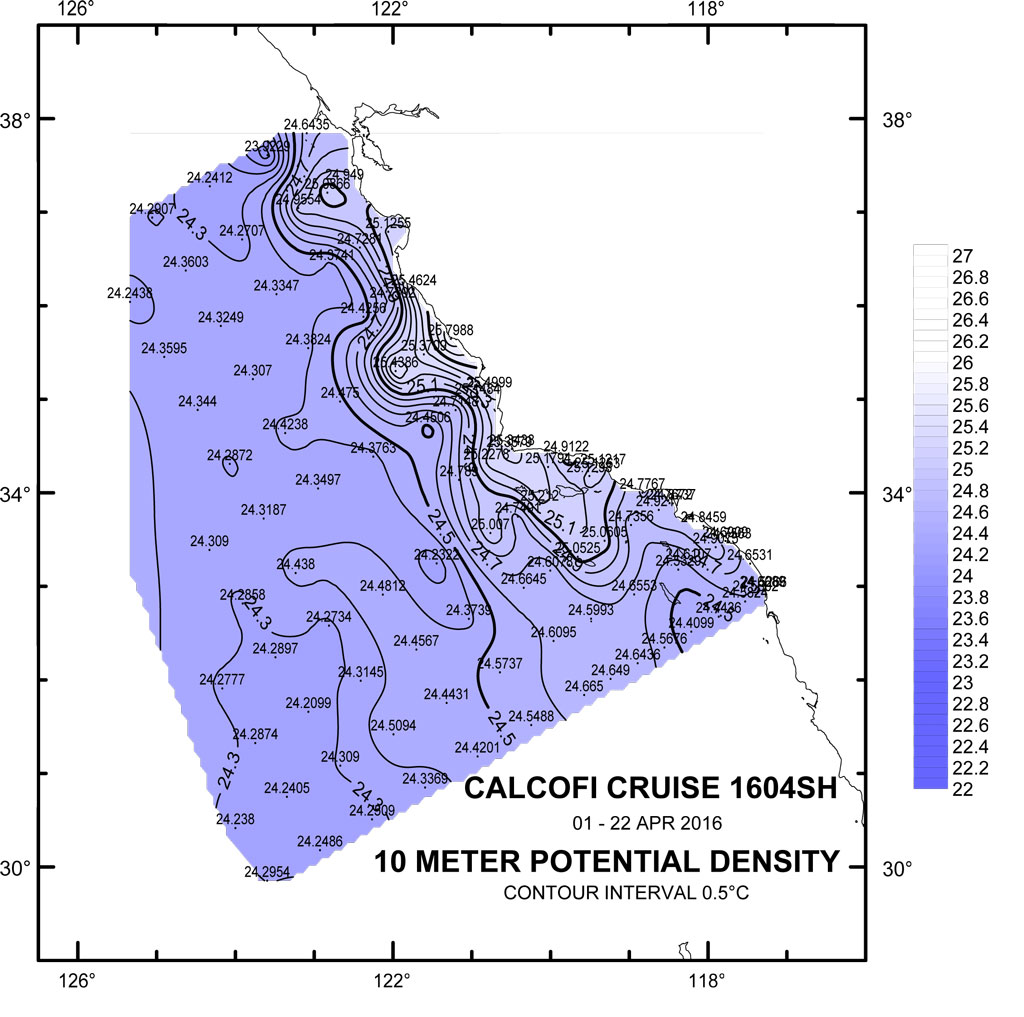
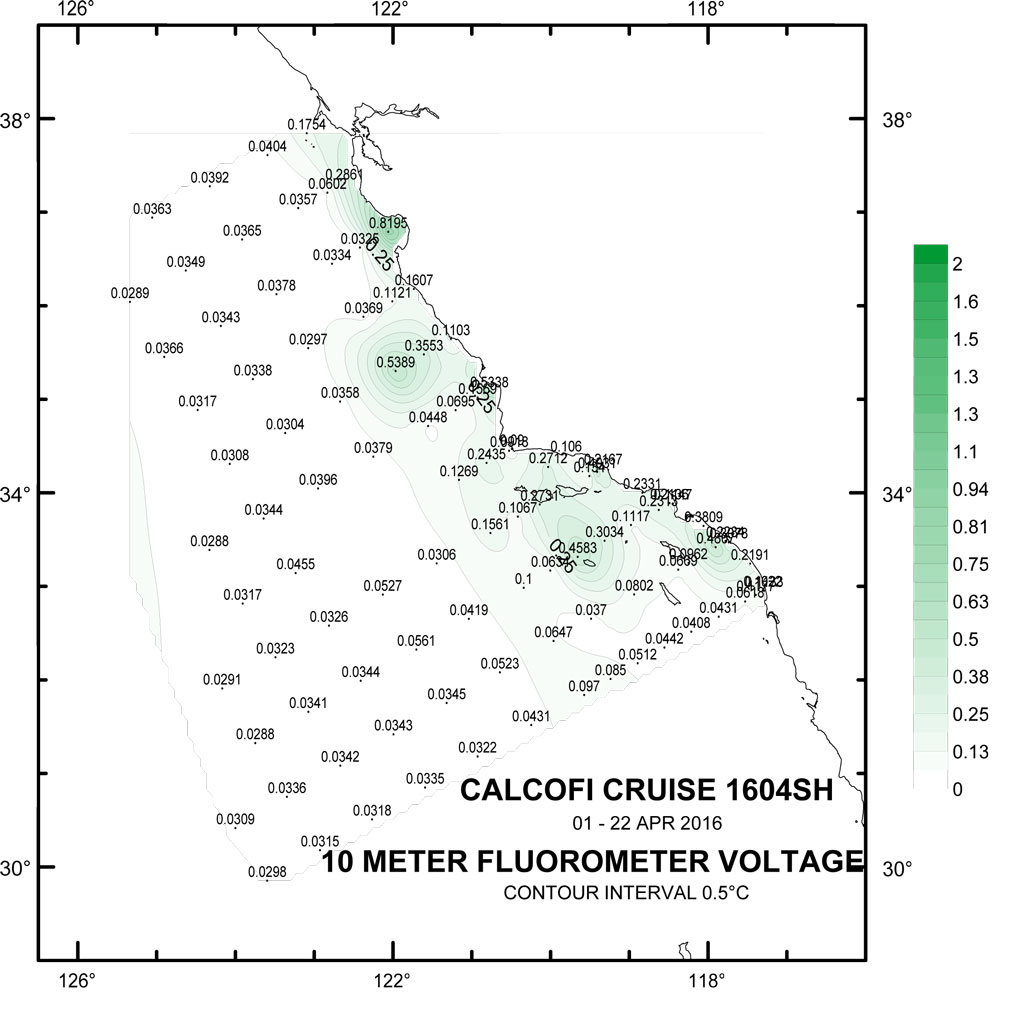
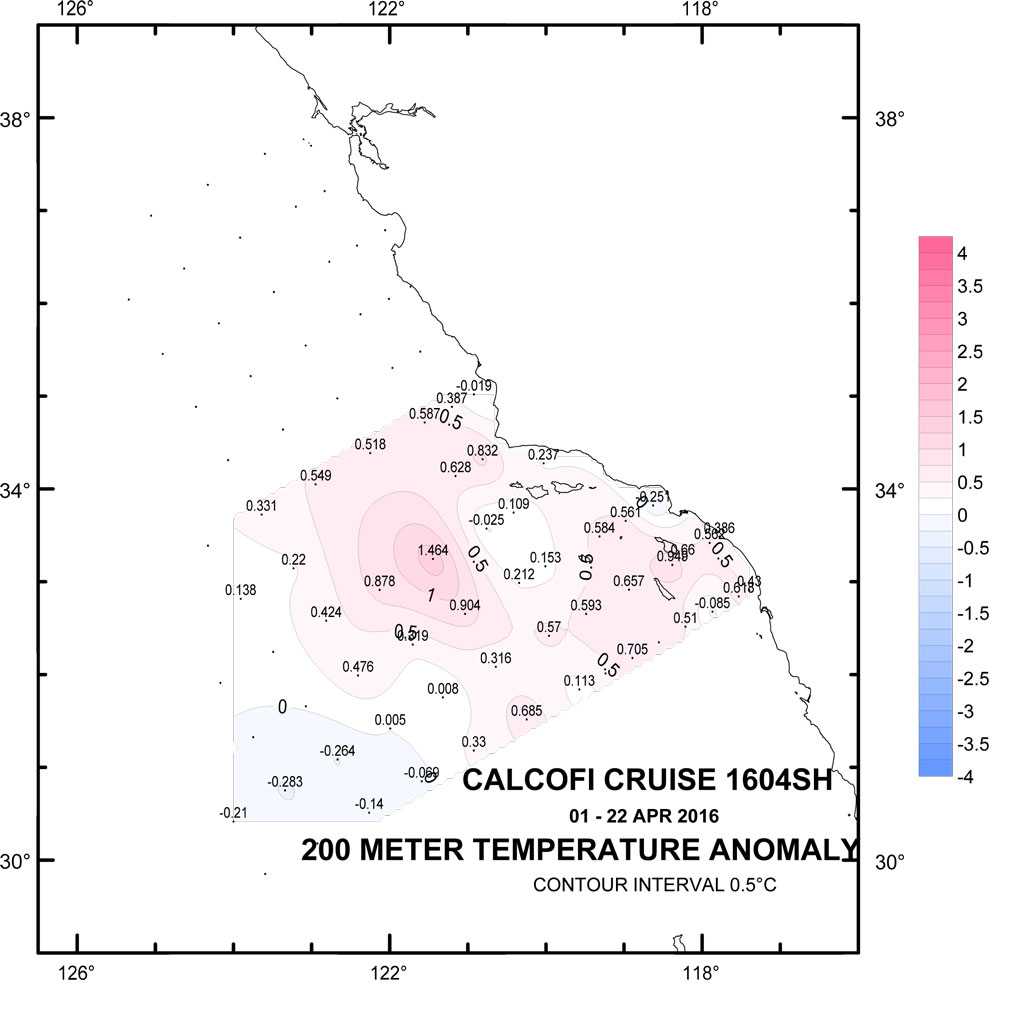
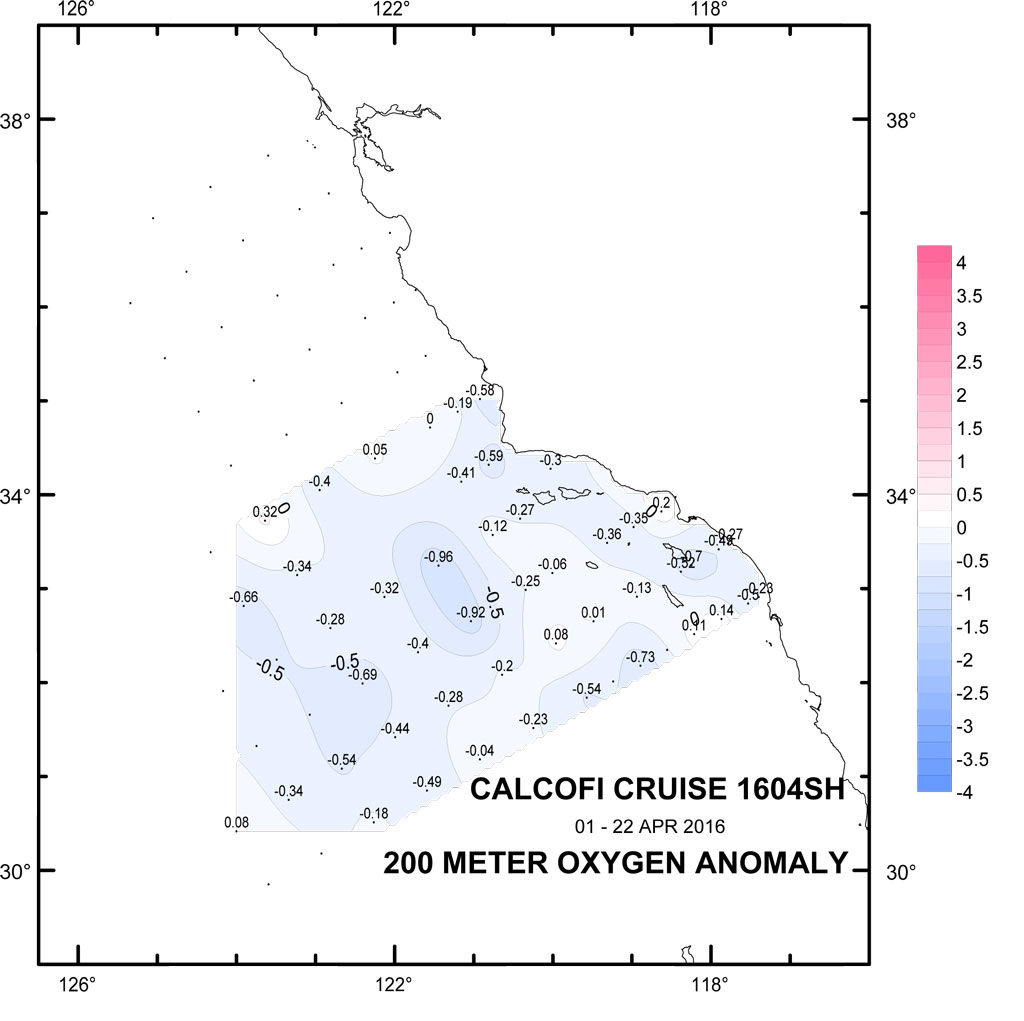
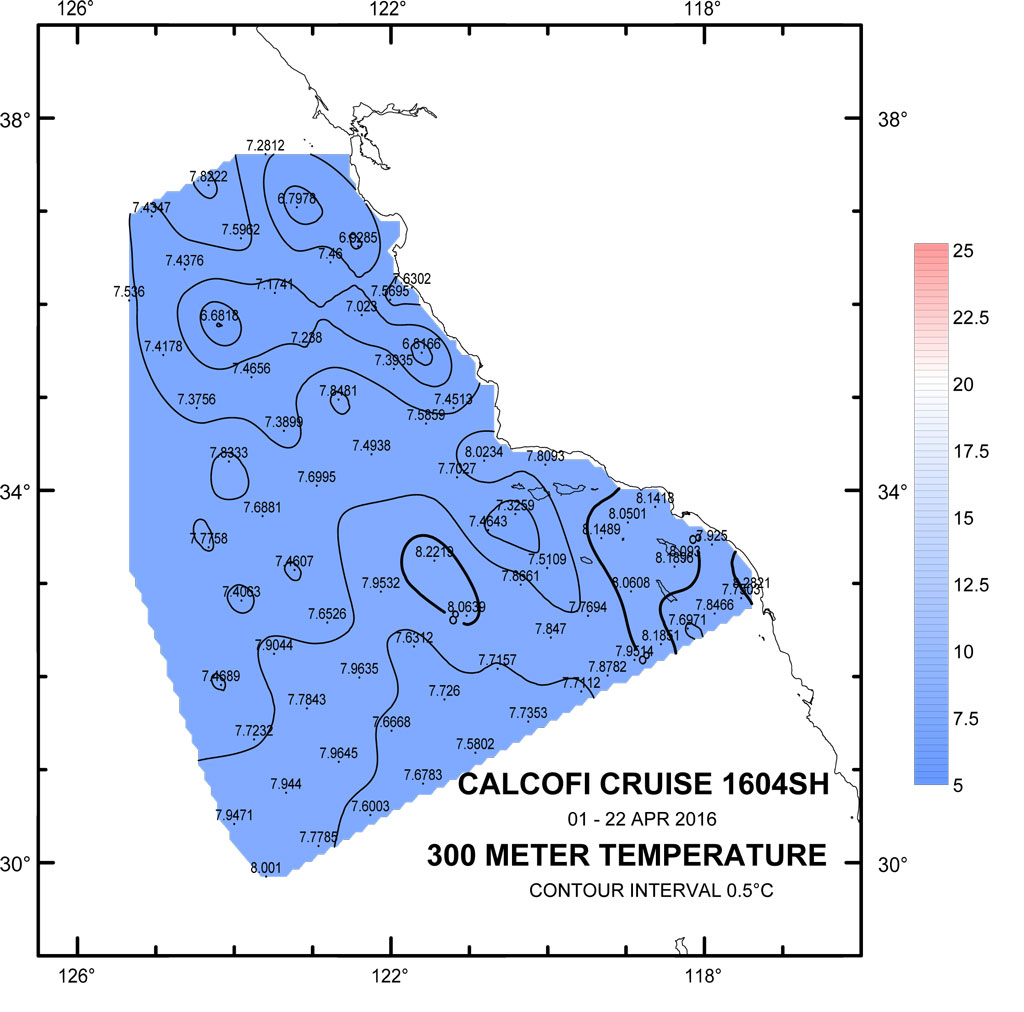
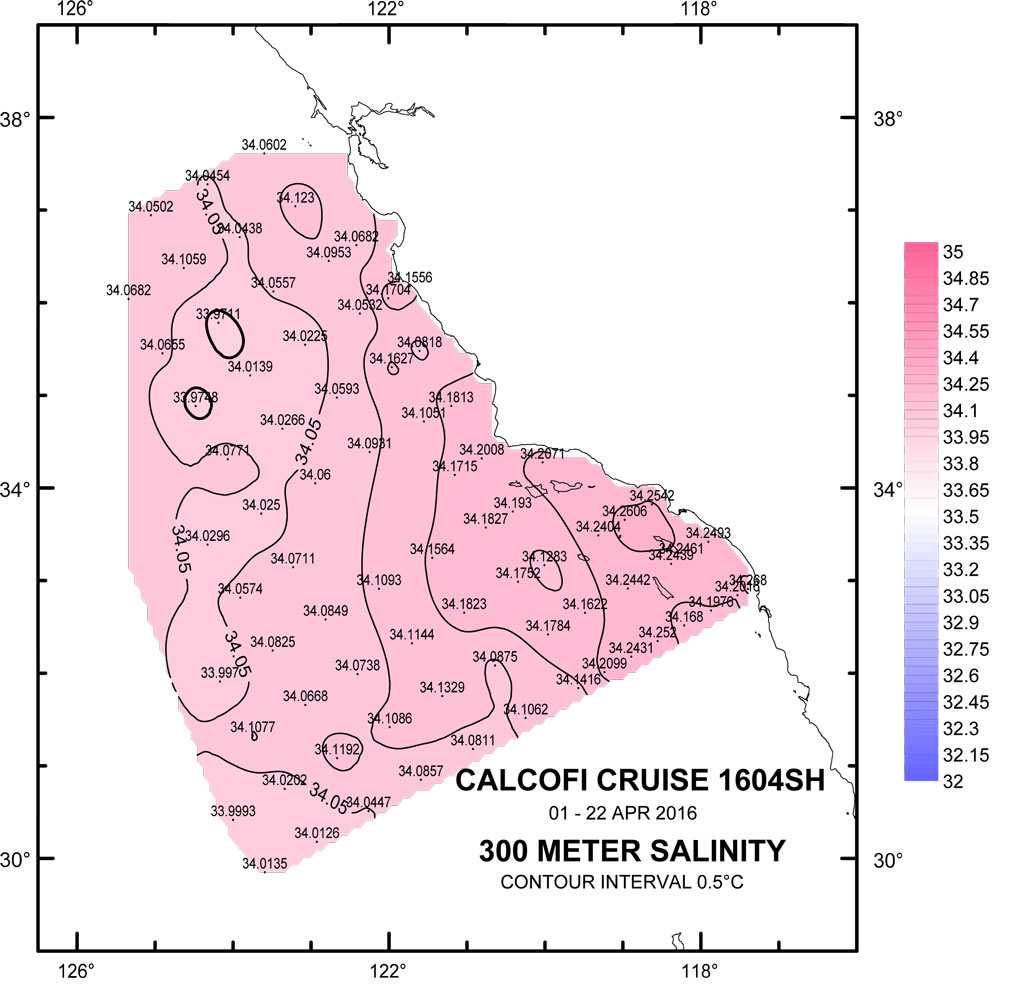
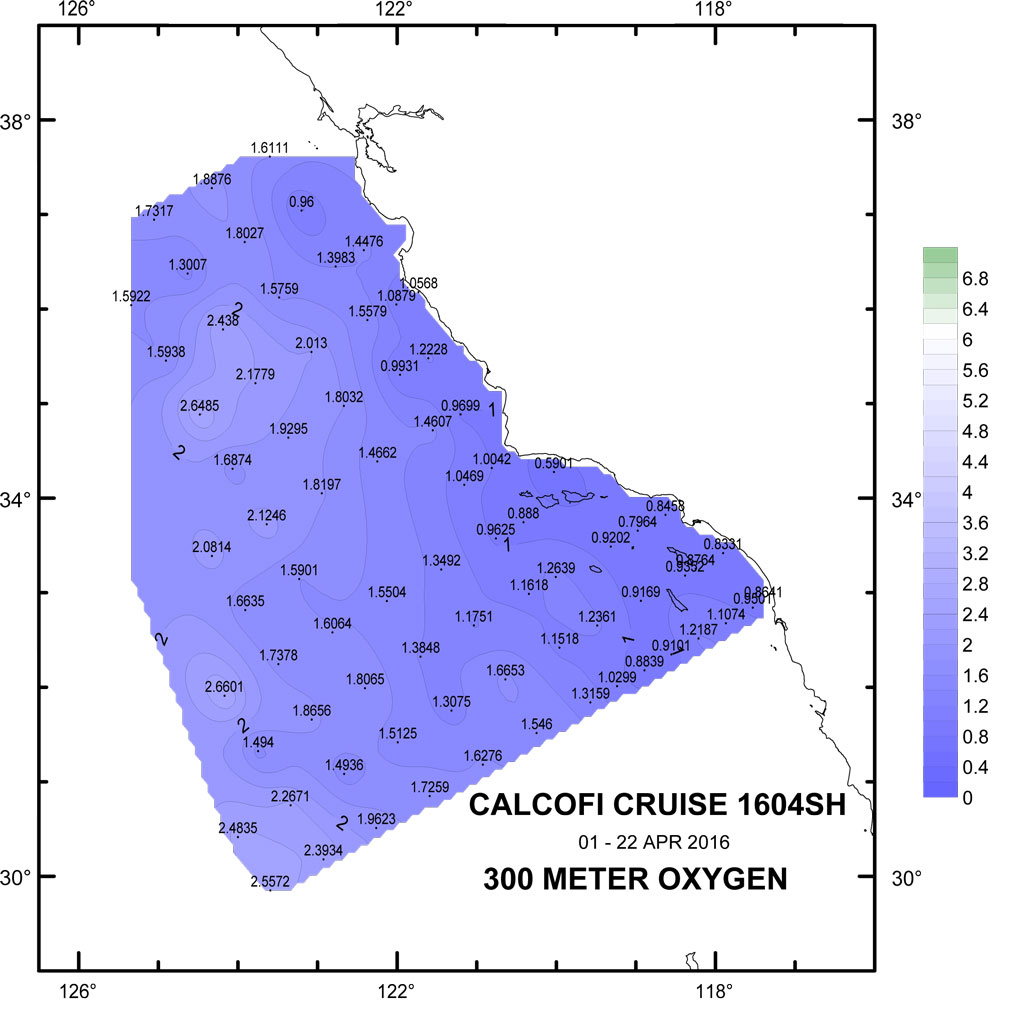
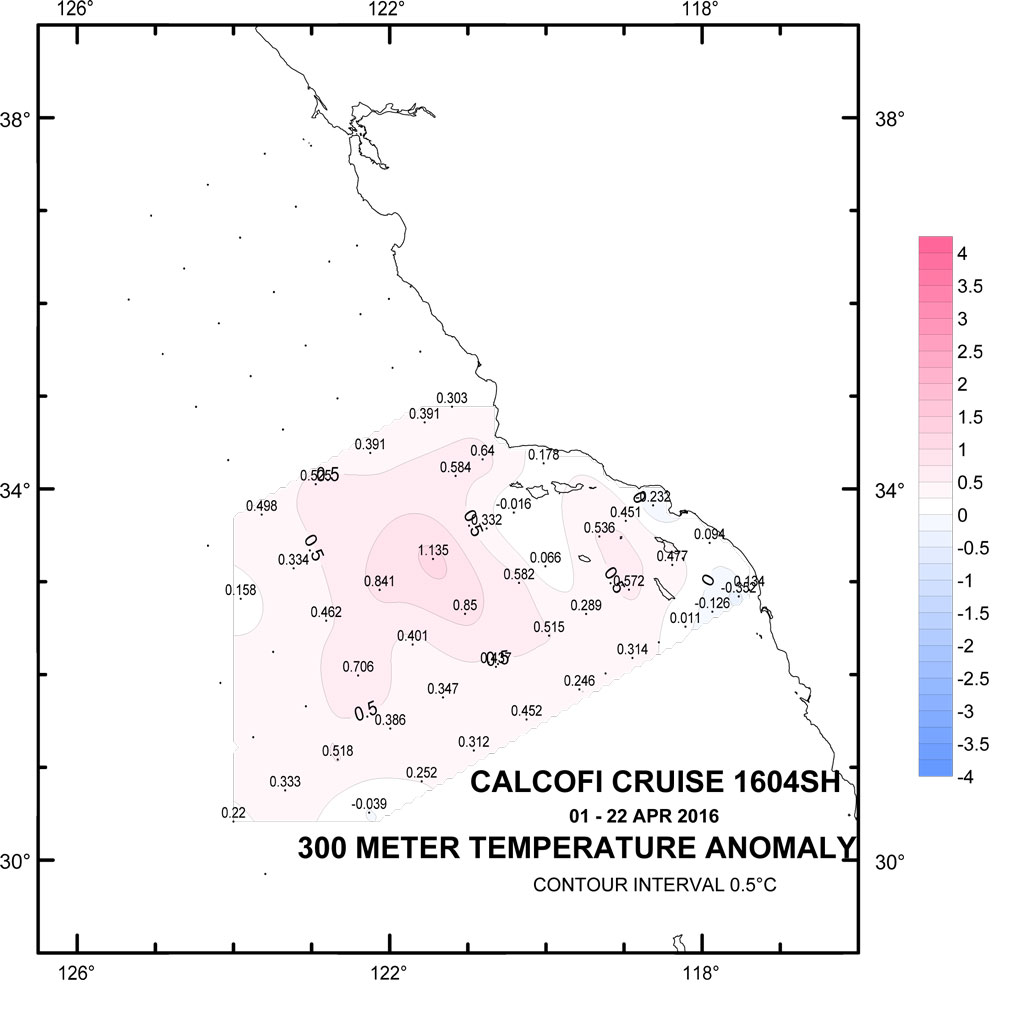
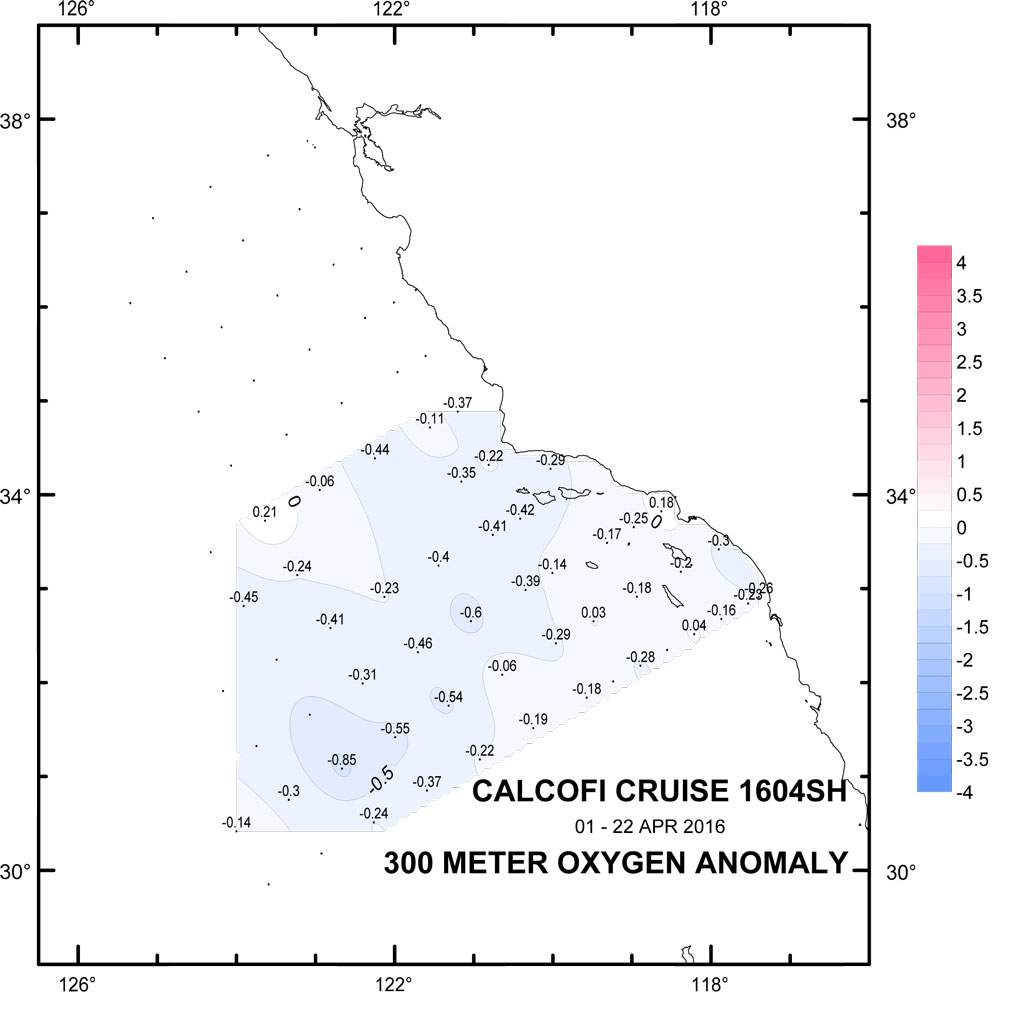
Please note that the anomalies are based on 50-year harmonics (1949-1999) and these data are 1m binavg Seasoft-processed CTD data that have not gone through thorough quality control checks or bottle corrections. They are presented to give a general impression of current conditions. Final data plots will be published after all data are processed. Please note that these plots are missing stations 80.80 & 80.70 due to bad weather. Anomaly data are not available on stations north of line 76.7 since they are typically only occupied on the Winter and Spring cruises, inconsistently.
| 10 & 100 meter Preliminary CTD Data & Anomaly (50yr mean) Contours (Click for larger image) | ||
 |
 |
 |
 |
 |
 |
 |
 |
 |
 |
 |
 |
 |
 |
 |
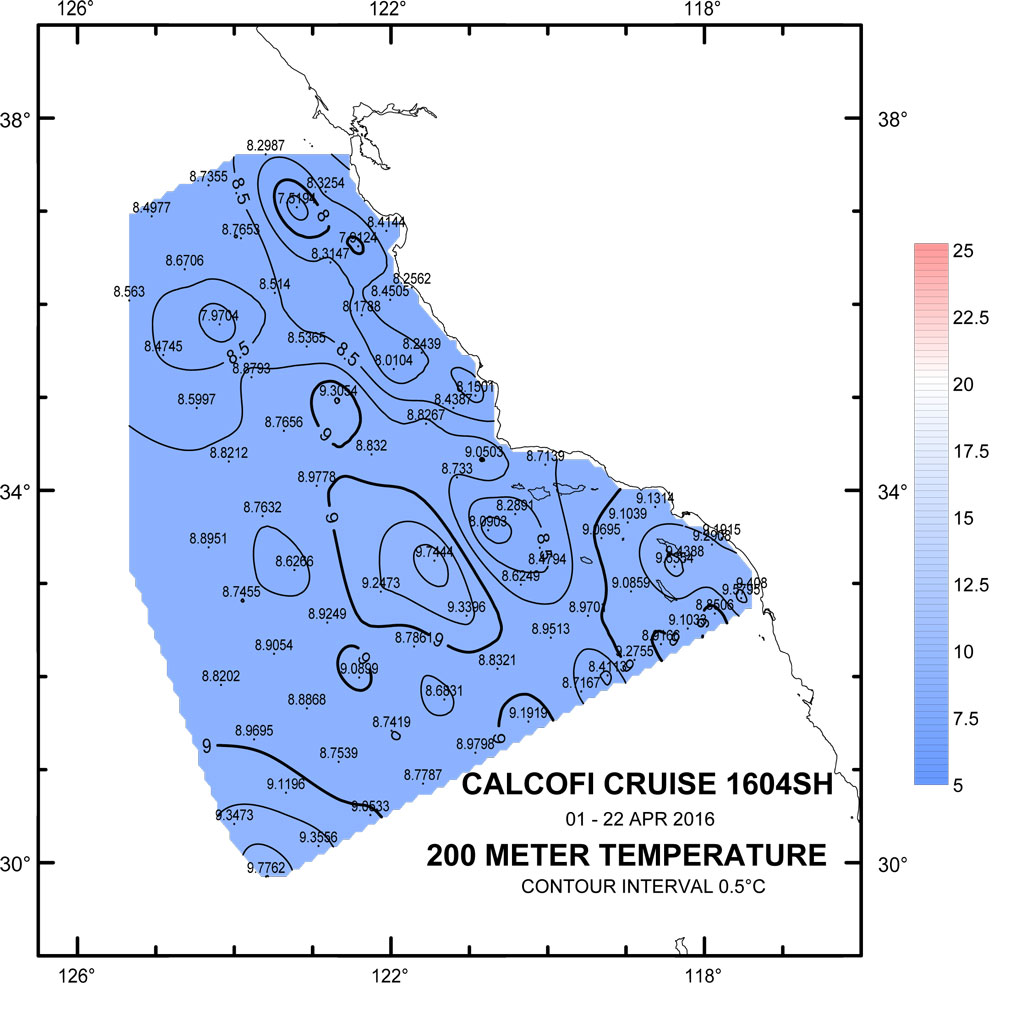
| 200 meters (Click for larger image) | ||
 |
 |
 |
 |
 |
 |
| 300 meter (Click for larger image) | ||
 |
 |
 |
 |
 |
 |