| Summary: | 1507OC Summer CalCOFI cruise on RV Oceanus; 08 - 25 Jul 2015; 71 stations (62 standard & 8 SCCOOS) successfully occupied. Stations 86.7 110, 83.3 110, 76.7 100.0, & 85.4 35.8 were cancelled to maximize remaining shiptime, reduced by ship equipment failures. No delays or station cancellations were due to bad weather or scientific equipment failures. All PRPOOS tows on lines 90.0 & 80.0 were performed but tows on lines 83.3 & 86.7 were cancelled. ~75hrs of shiptime were lost due to personal emergency and two separate ship equipment failures (refrigeration unit & seal to main generator cooling pump). The cruise was extended one day to help recover time & minimize station loss; originally, the ship was to return 24 Jul. |
| Data Files: | 1507OC Preliminary Plots; 1507OC CTD (raw) Cast files; 1507OC FinalQC Bottle-corrected CTD Files |
| Load Dates: | 06 - 07 Jul 2015 (Mon-Tue) at 10th Ave Marine Terminal, San Diego, CA |
| Cruise Dates: | 08 - 25 Jul 2015 (Wed - Sat) |
| Offload Date: | 25 Jul 2015 (day-of-return; Sat) at 10th Ave Marine Terminal, San Diego CA. IOD van unload was performed 27 Jul 2015 along with chemical & rad waste removal. |
| Ship: | OSU RV Oceanus |
| Communication: | Cellular: 541-207-598; IRIDIUM: 011-881-641-413-524; VHF-FM Channels 13 & 16, call sign WXAQ |
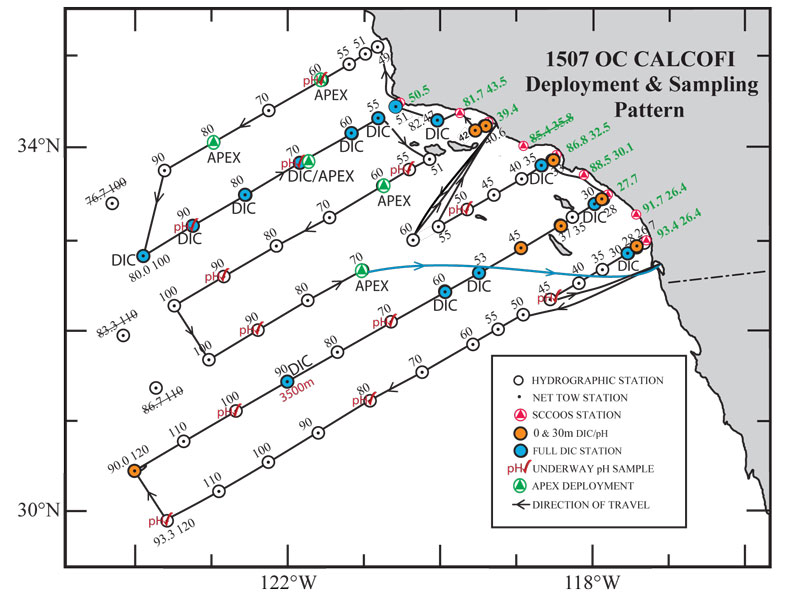
| Station plan: | 75 Standard (66 CalCOFI + 9 SCCOOS); Project Instructions (PDF); please note the alternate station pattern on lines 83 & 80. Please note the actual cruise track which changed midcruise to avoid rough weather and facilitate maximum station occupation. |
| Deck/Lab plans: | 2-van main deck & lab layouts |
| Cruise Forms: | OSU Cruise Participants Form PDF; Cruise Planning Manual web page |
| Cruise Map: | |
 |
|
| Contacts: | James Wilkinson, Chief Scientist, IOD SIO-CalCOFI |
| Amy Hays, SWFSC-NOAA Technical Coordinator | |
| Jennifer Rodgers-Wolgast, IOD SIO-CalCOFI Volunteer Coordinator | |
| CTD Processing Summary CalCOFI 1507OC CTD Final Data | |||
| Download 1507OC CTD raw cast files zipped | Download 1507OC FinalQC CTD + bottle data Note: primary oxygen sensor data on casts 4 & 5 are bad. The sensor was replaced on cast 6. | ||
| General CTD Notes - data acquisition notes, logistics, processing - see below. Please note that these regressions are generated from FINAL CTD vs bottle data. CTD temperatures and salinities have not change much but oxygen, estimated chlorophyll-a, estimated nitrate may have change slightly after point-checking. |
|||
| CTD sensor corrections derived by comparing CTD sensor data, 4sec average prior to bottle closure, to bottle samples | |||
| Dual T, S, & O2 | Primary Sensor | Secondary Sensor | |
| Salinity offset (bottle - CTD salinity; > 350m only; Seabird SBE4) | 0.0010 | 0.0039 | |
| Oxygen ml/L (dual Seabird SBE43; 2° O2 Calib Good) | y= 1.0528x - 0.0219 R² = 0.9996 |
y = 1.0381x - 0.0158 R² = 0.9996 |
|
| Oxygen umol/Kg (dual Seabird SBE43; 2° O2 Calib Good) | y= 1.0547x - 0.8194 R² = 0.9996 |
y = 1.0399x - 0.5543 R² = 0.9996 |
|
| Single sensors | Linear | Polynomial | |
| Nitrate - ISUS 4sec ave voltage vs Bottle Nitrate (Satlantic MBARI-ISUS v2) |
y= 28.031x - 8.7794 |
||
| Fluorometer - linear & polynomial regressions |
y = 7.4981x - 0.2437 R² = 0.7392 |
y = -0.182x2+7.5075x-0.2442 R² = 0.7392 |
|
 |
 |
||
 |
 |
||
 |
 |
||
Please note that the anomalies are based on 50-year harmonics (1949-1999) and these data are 1m binavg Seasoft-processed CTD data that have not gone through thorough quality control checks or bottle corrections. They are presented to give a general impression of current conditions. Final data plots will be published after all data are processed.
| 10 & 100 meter Preliminary CTD Data & Anomaly (50yr mean) Contours (Click for larger image) | ||
 |
 |
 |
 |
 |
 |
 |
 |
 |
 |
 |
 |
 |
 |
 |
| 200 meters (Click for larger image) | ||
 |
 |
 |
 |
 |
 |
| 300 meter (Click for larger image) | ||
 |
 |
 |
 |
 |
 |
