- CalCOFI 0911NH • 6 - 23 Nov 2009 • SIO RV New Horizon • San Diego to San Diego
| CTD Processing Summary CalCOFI 0911NH CTD Final Data (reprocessed/reformatted 02/2018) | |||
| Download 0911NH CTD raw cast files zipped | Download 0911NH FinalQC CTD + bottle data | ||
| General CTD Notes - data acquisition cast notes, logistics, processing notes are listed below | |||
| CTD sensor corrections derived by comparing 4 secs of CTD sensor data (prior to bottle closure) to bottle samples | |||
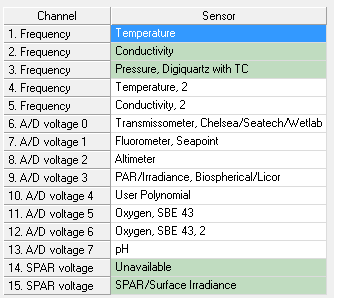
| Dual T, S, & O2 | Primary Sensor | Secondary Sensor | |
| Salinity offset (bottle - CTD salinity; > 350m only; Seabird SBE4) | 0.0011 | 0.0016 | |
| Oxygen (ml/L; dual Seabird SBE43) |
y = 1.0666x - 0.0296 R² = 0.9997 |
y = 1.0446x - 0.0288 |
|
| Oxygen (umol/Kg; dual Seabird SBE43) |
y = 1.0666x - 1.2901 R² = 0.9997 |
y = 1.0446x - 1.2586 R² = 0.9998 |
|
| Single sensors | |||
| Nitrate - ISUS 4sec ave voltage vs Bottle Nitrate (Satlantic MBARI-ISUS v2) |
y = 28.387x -10.892 R² = 0.9921 |
Please note the ISUS had serious undetermined issues so many casts do not have ISUS estimated nitrate data. | |
| Fluorometer - linear & polynomial regressions |
y = 2.391x + 0.0382 R² = 0.7331 |
y = -2.6418x2 + 3.6471x - 0.025 R² = 0.7727 |
|
 |
 |
||
 |
 |
||
 |
 |
||
| General notes: | |||
|
CalCOFI 0911NM 6 - 23 Nov 2009
. |
|||
|
Cast specific Notes from Console Ops: JRW 02/06/2018 |
|||
CalCOFI 0911NM 6 - 23 Nov 2009
The fall 2009 CalCOFI started off smoothly and we remained ahead of station schedule until sailing into some high winds and large swells near San Nicolas Island. The weather continued to deteriorate until we made it back inshore on line 83. Just in time to head back out into more bad weather once again. At this point we were still on schedule, having to cancel the nets on a few stations. Not until approaching 77.55 did we have to cancel all operations due to another bout of increasing winds and swell. Despite all the bad weather, we managed to get all CTD casts in our station plan. Here is what the preliminary hydrographic data are showing us:
The 100 meter temperature anomaly shows a mild El Nino in the inshore counter current (+.8 ºC over the 50 year mean). There are two pulses of positive temperature anomalies in deeper 300 meter water. The first one is inshore near the Channel Islands. Higher anomalies are seen in the deeper waters offshore around station 80, through all the CalCOFI lines possibly due to warm core eddies from the gyre. The surface temperatures, however, show cooler temperatures compared to the 50 year mean, with only slight inshore warming north of Catalina Island, between lines 87 and 90. The 10 meter surface salinities throughout the pattern are mostly lower than the 50 year mean, with a high around the northwest corner on stations 80.90 and 77.90, possibly due to gyre waters. Ten meter chlorophyll has been low throughout the cruise, increasing on line 77 on the last four inshore stations that we almost missed due to bad weather.
Halobates was collected in several manta tows in the northwest corner of the pattern. These ocean insects are usually only seen during El Nino years.
Marine mammal detections, both visual and acoustic, were reduced during this cruise compared to past cruises, primarily because of rough weather. Out of 37 cetacean sightings three species of baleen whales, five species of dolphins, one species of porpoise and two species of pinnipeds were identified. No sperm whales were positively identified. Confirmation of acoustically detected species was also reduced because of poor visibility due to weather.
The number of acoustic detections by species includes: (total of 69 marine mammal detections)
Common dolphins (Delphinus spp.): 9
Unidentified dolphins: 39
Possible Dall’s porpoise (Phocoenoides dalli): 1
Possible Blue whale (Balenoptera musculus): 1
Possible Blue or Fin (Balenoptera pysalyus) whales: 10
Possible Humpback whale (Megaptera novaengliae): 1
Sperm whale (Physeter macrocephalus): 1
Possible Sperm whale: 7
Mostly due to the help of our fantastic trio of volunteers and having more personnel on each watch, did we successfully pull off many rough CTD deployments. Not to mention the superior driving skills of the captain and mates on board this cruise and our seasoned winch operators landing the CTD effortlessly. I also cannot forget to mention the efforts of the cooks, working hard no matter what kind of weather to make sure we were fed superb meals even through crashing dinnerware on multiple occasions. Our appreciation sees no bounds. My thanks goes out to everyone for pulling off a successful cruise.
Jennifer Rodgers-Wolgast, Chief Scientist
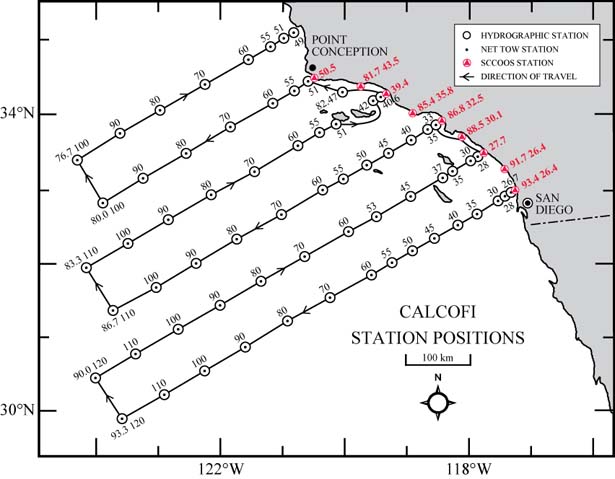
Clickable Station Data Map
This map may not reflect the actual cruise track and stations completed.
 |
0911NH Underway Data Processing Notes
There are two FL columns in the Raw Data one is bogus. Also over half the data was collected with a flow rate >2.5 L/min this is bad. From SBE Technical Support :
Doubling the flow rate from what we recommend will have at least one main problem. This flow rate will probably be too high for the conductivity cell and overtime you can see a degradation of the conductivity readings due to this flow rate. What can happen is that the high flow rate may slowly remove the platinum on the electrode within the conductivity cell, especially in areas with a lots of debris and particulate in the water. This will change the area of the conductivity cell which can cause the readings to be high of correct. I am unsure how long this process would take but it is something we have seen before. I really suggest using the recommended flow rate for this instrument.
Data correlation is pretty bad. For salt and ChlA. I culled all salt less than 32.97 to remove some dropouts but BTL agreement is still very poor. I am debating weather or not to even publish (R² = 0.14). There are a few -99s that I deleted from the graphs but they are still in the data. Chlorophyll isn't much better (R²=0.19) if I do publish I'll color the data above and below 6.7mg/L. Temp came in at R²=0.6406; not great. Even if I remove the bad flow rate data the correlation does not improve, it in fact gets worse. You can see the data in 0911NH_CTDvsUnderway.xlsx.