CalCOFI 1701RL
| CTD Processing Summary CalCOFI 1701RL CTD Final Data | |||||
| Download 1701RL CTD raw cast files zipped | Download 1701RL FinalQC CTD + bottle data | ||||
|
General CTD Notes - data acquisition notes, logistics, processing - see below. |
|||||
| CTD sensor corrections derived by comparing CTD sensor data, 4sec average prior to bottle closure, to bottle samples | |||||
| Dual T, S, & O2 | Primary Sensor | Secondary Sensor | |||
| Salinity offset (bottle - CTD salinity; > 350m only; Seabird SBE4) | -0.0004 | -0.0034 | |||
| Oxygen ml/L (dual Seabird SBE43; 2° O2 Calib Off) |
y = 1.0103x+0.0092 R² = 0.9996 |
y = 1.0562x - 0.0003 R² = 0.9996 |
|||
| Oxygen umol/Kg (dual Seabird SBE43; 2° O2 Calib Off) |
y =0.0108x+0.8621 R² = 0.9996 |
y = 1.0562x - 0.0003 R² = 0.9996 |
|||
| Single sensors | Linear | Polynomial | |||
|
Nitrate - ISUS 4sec ave voltage vs Bottle NO3 (Frank's Satlantic ISUS v3) Cast 001 - 020 (pre-calibration) |
y = 36.489x - 1.3351 R² = 0.9466 |
y = -18.449x2 + 57.489x - 2.2373 R² = 0.9626 |
|||
| Nitrate - ISUS 4sec ave voltage vs bottle NO3; Cast 021 - 083 (post-calibration) |
y = 27.903x - 4.3872 R² = 0.987 |
||||
| Fluorometer - linear & polynomial regressions |
y=7.0294x-0.2322 R² = 0.8105 |
y = 6.7661x2 + 5.5486x - 0.1745 R² = 0.8128 |
|||
 |
 |
||||
 |
 |
||||
 |
 |
||||
 |
|||||
| Project: | CalCOFI 1701RL, Winter CalCOFI on NOAA RV Reuben Lasker |
| Summary: |
CalCOFI 1701RL sailed from 10th Ave Marine Terminal, San Diego Jan 05 2017 at 1300PST.
|
| Data files/links: | 1701RL Raw CTD Cast Files; 1701RL FinalQC CTD+Bottle Data Files; Prelim. Horizontal Contour Plots |
| Instructions: | CalCOFI 1701RL Cruise Instructions |
| Cruise Dates: | Thursday, 05 Jan 2017 - Sunday, 29 Jan 2017 |
| Loading: |
Early pre-holiday break loading: 19 - 21 Dec 2016 Tuesday, 04 Jan 2017 - Wednesday, 05 Jan 2017 morning; 10th Ave Marine Terminal, San Diego, CA |
| Offloading: | 30 Jan 2017; 10th Ave Marine Terminal, San Diego, CA |
| Partiicpant Forms: | NOAA Medical Forms - required for all cruise participants sailing Jan 05 2017 |
| Ship: | RV Reuben Lasker |
| Station plan: | 104 Stations (95 CalCOFI + 9 SCCOOS) were scheduled and 83 (74 CalCOFI + 9 SCCOOS) were successfully occupied due to severe weather Jan 20-24. Green transit is Leg I returning to San Diego; Blue transits are Leg II N & S transits. Red stations were CUFES surveyed only during the transit south. |
| Cruise Map: |
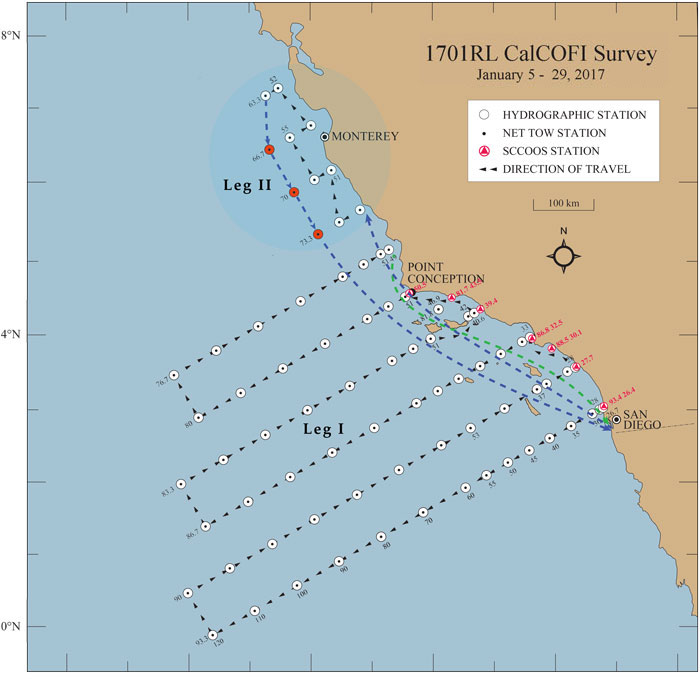 |
| Contacts: | Amy Hays, Chief Scientist, NMFS |
| Dave Wolgast, IOD (SIO Technical Coordinator) | |
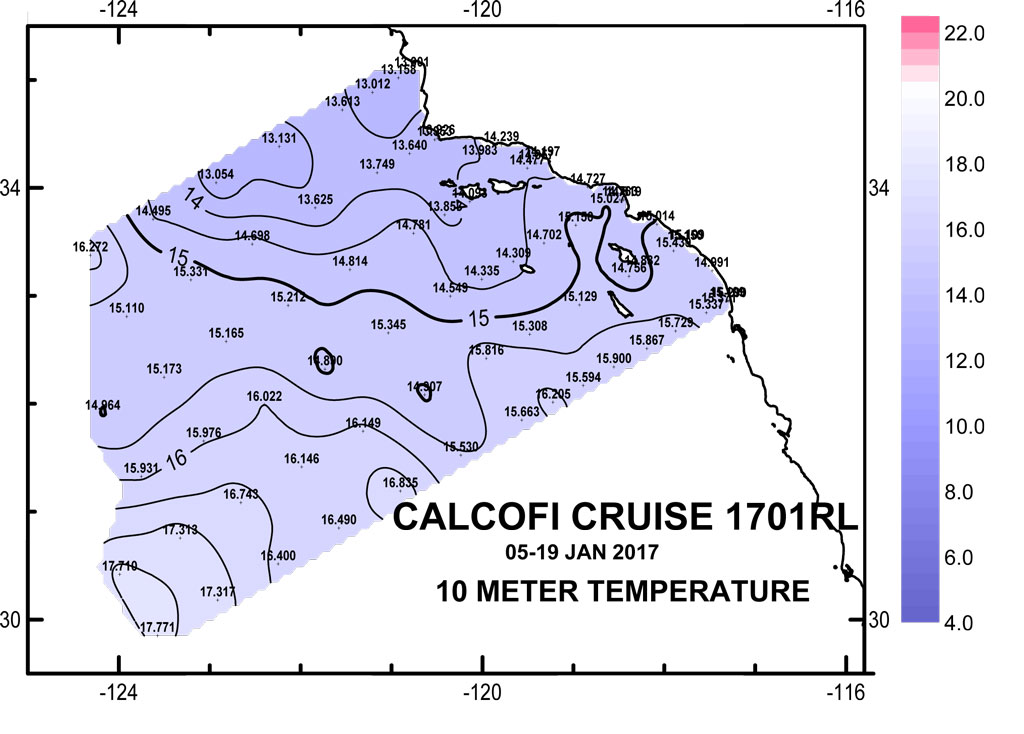
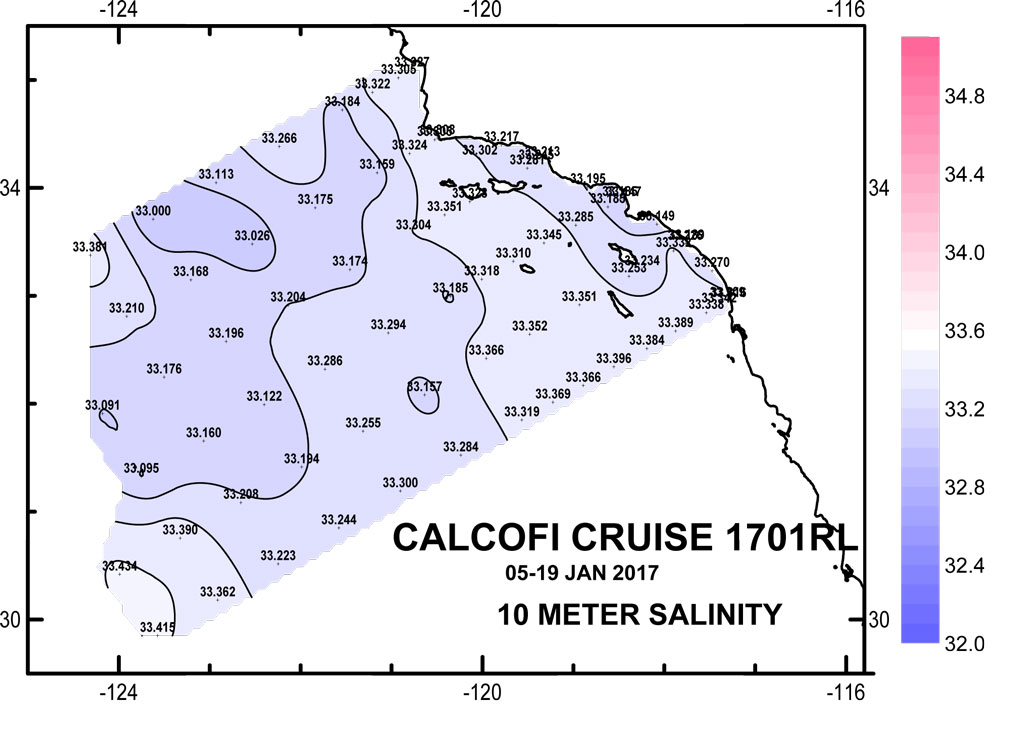
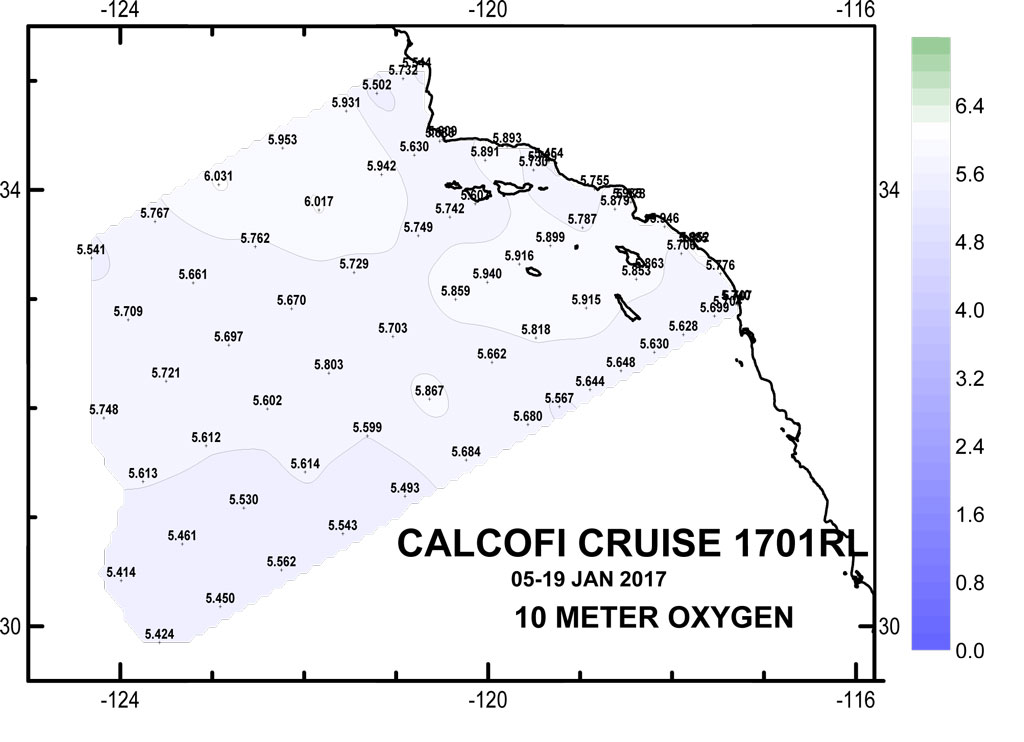
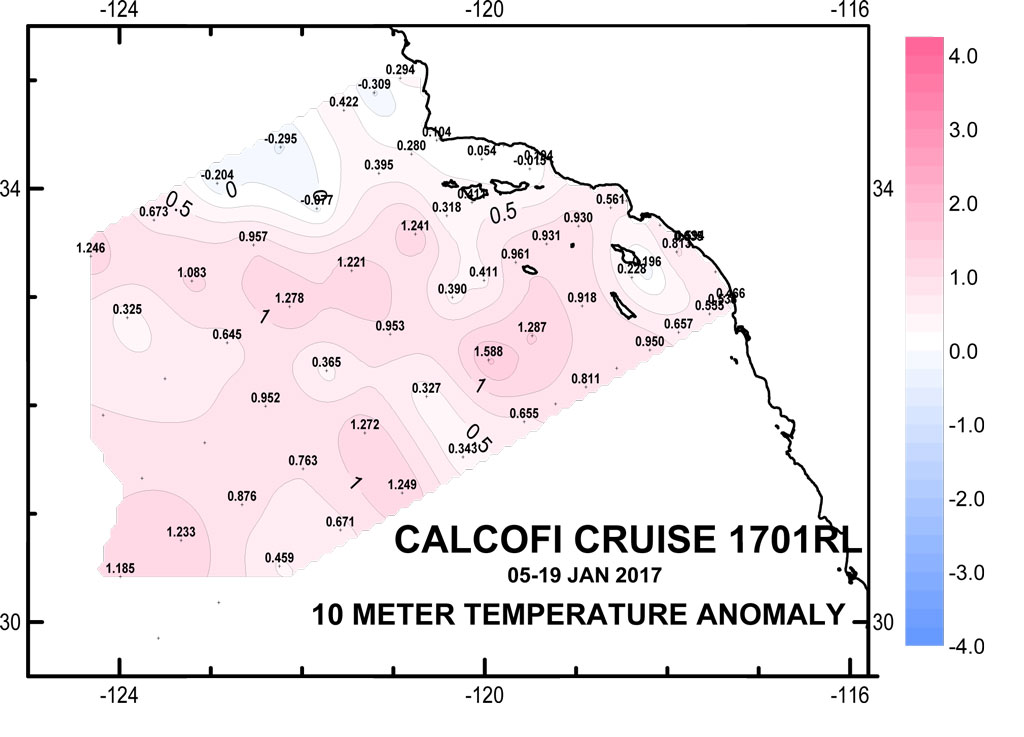
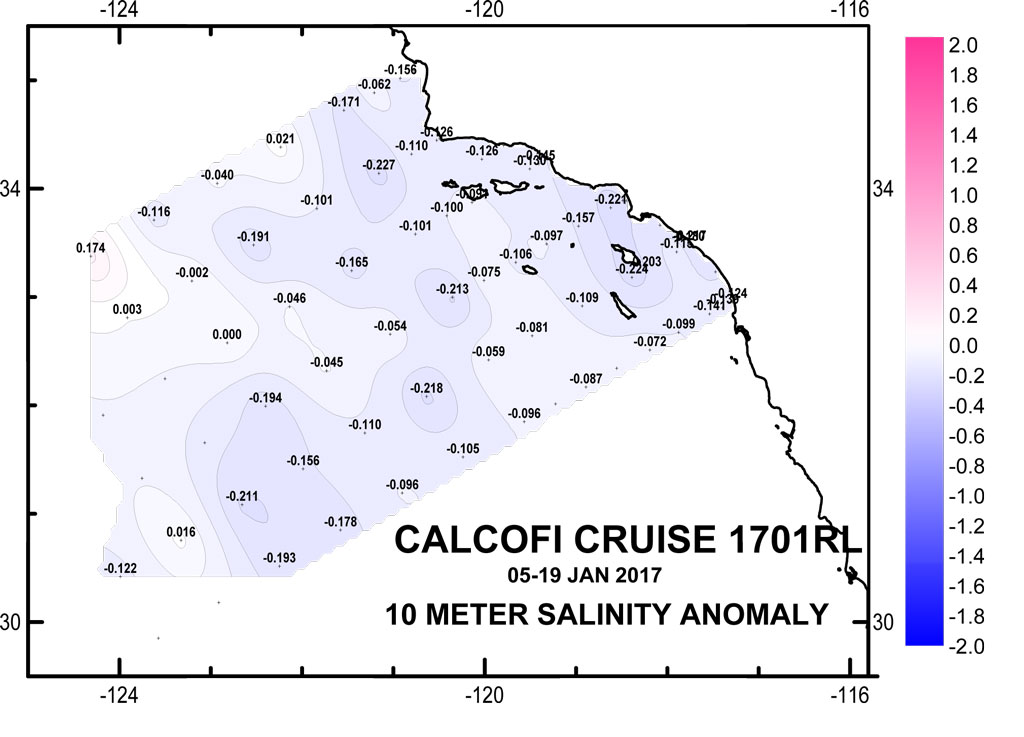
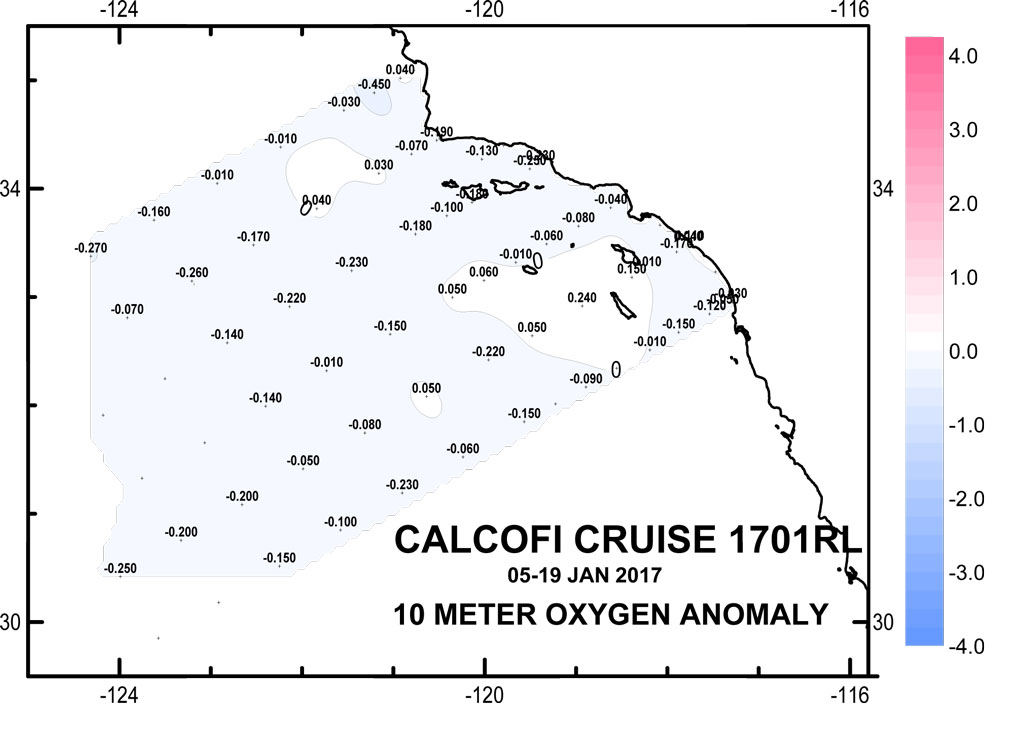
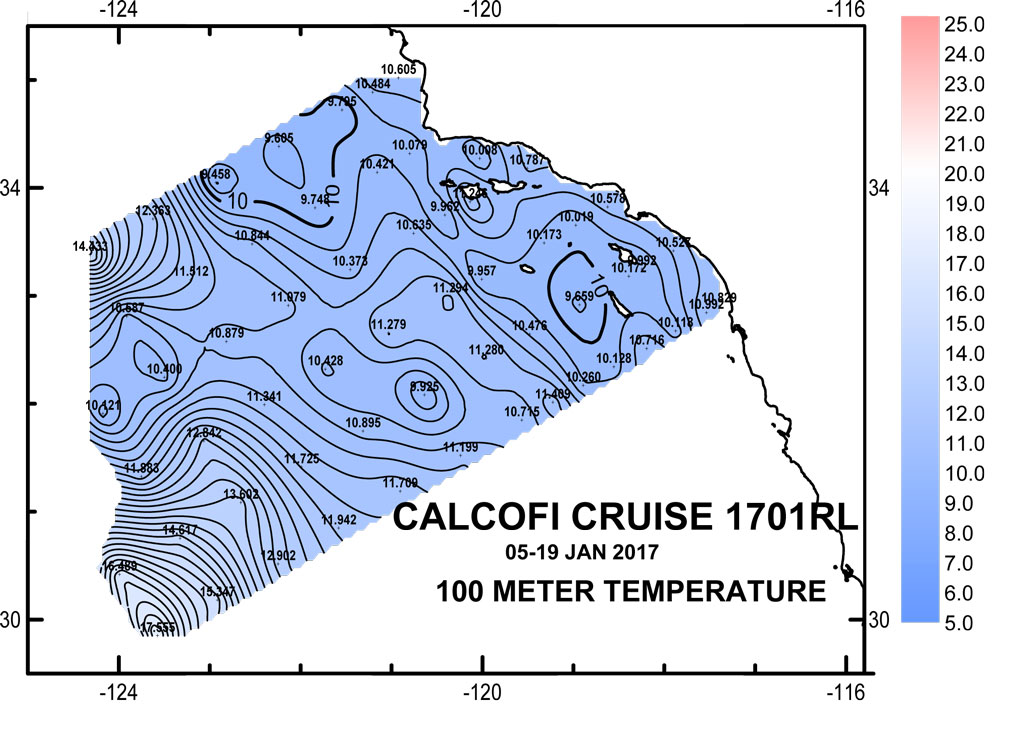
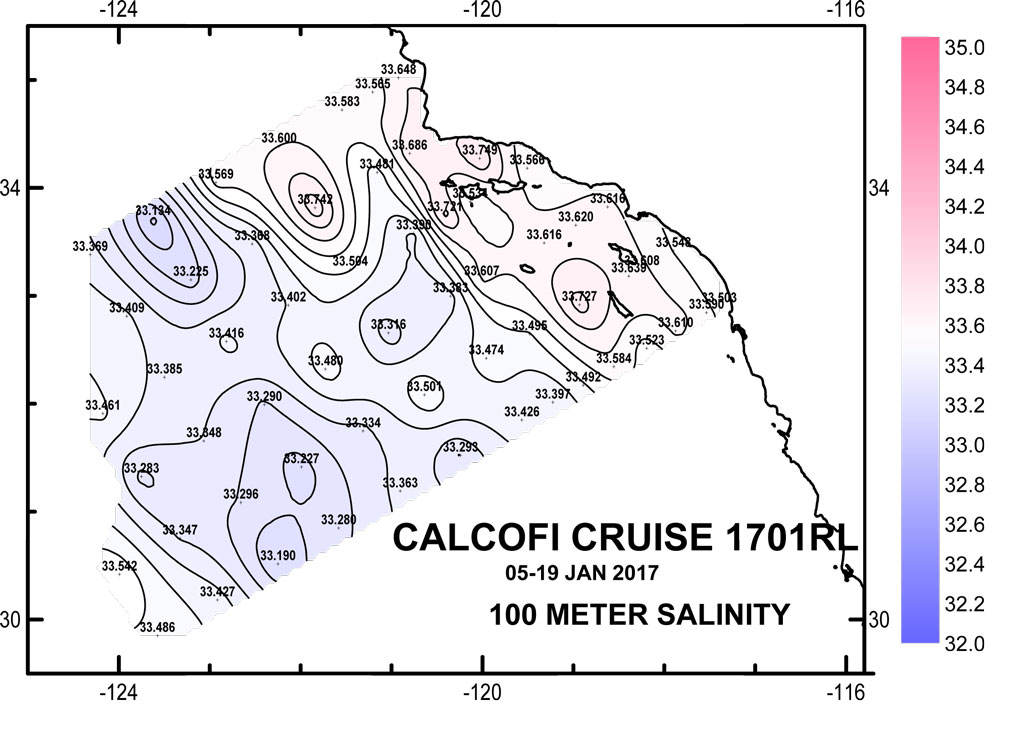
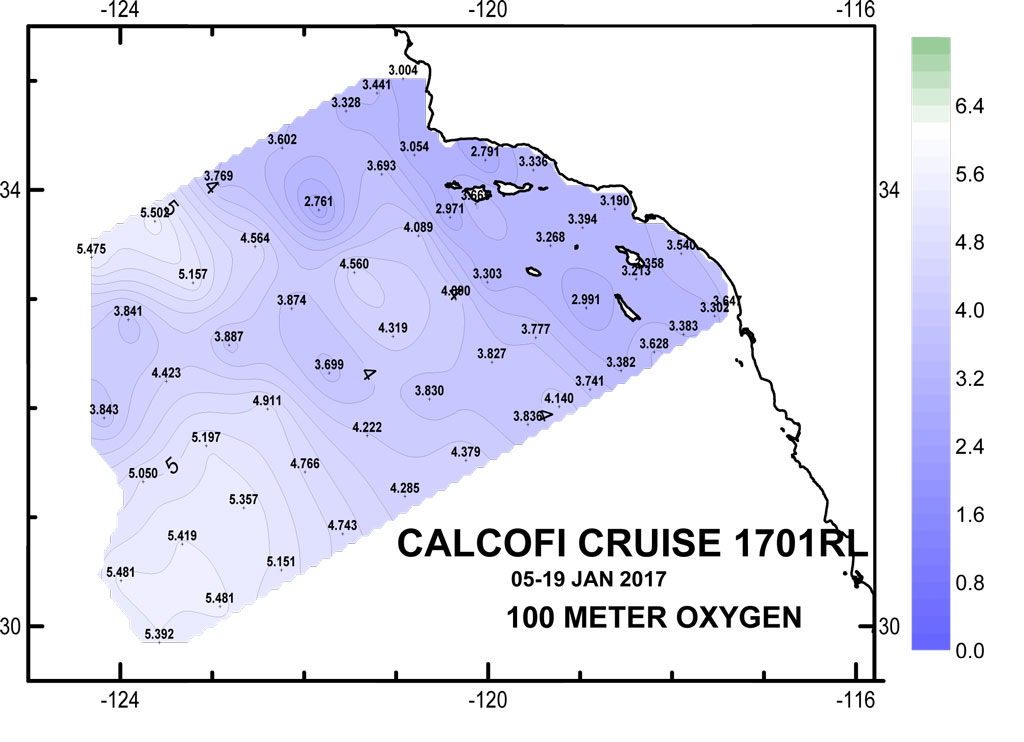
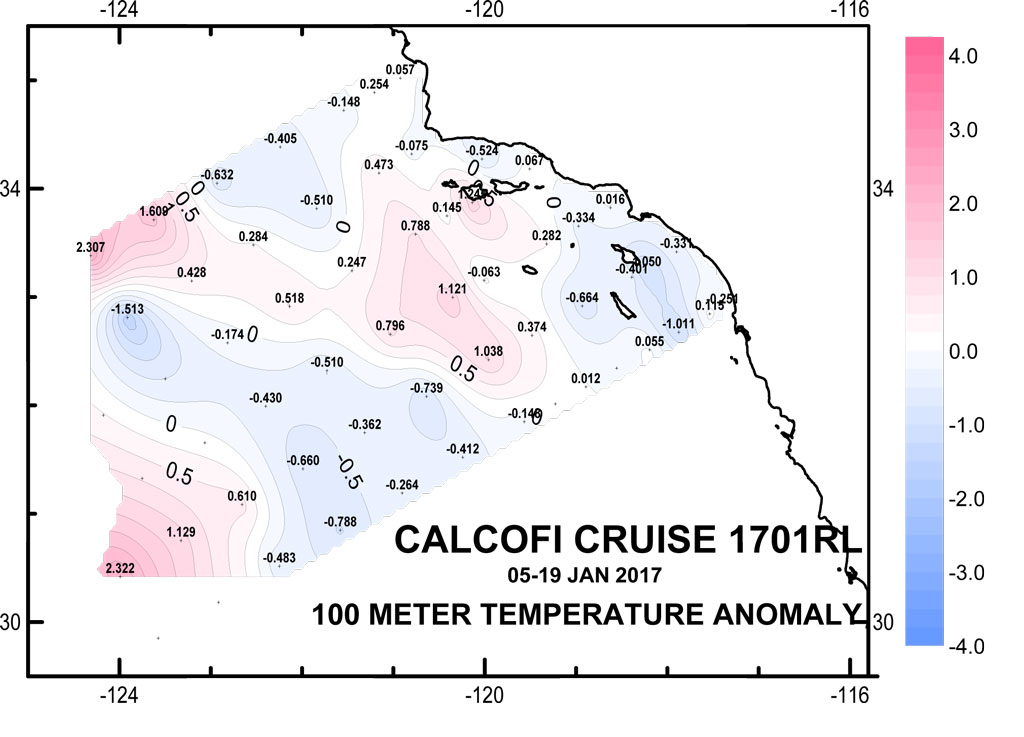
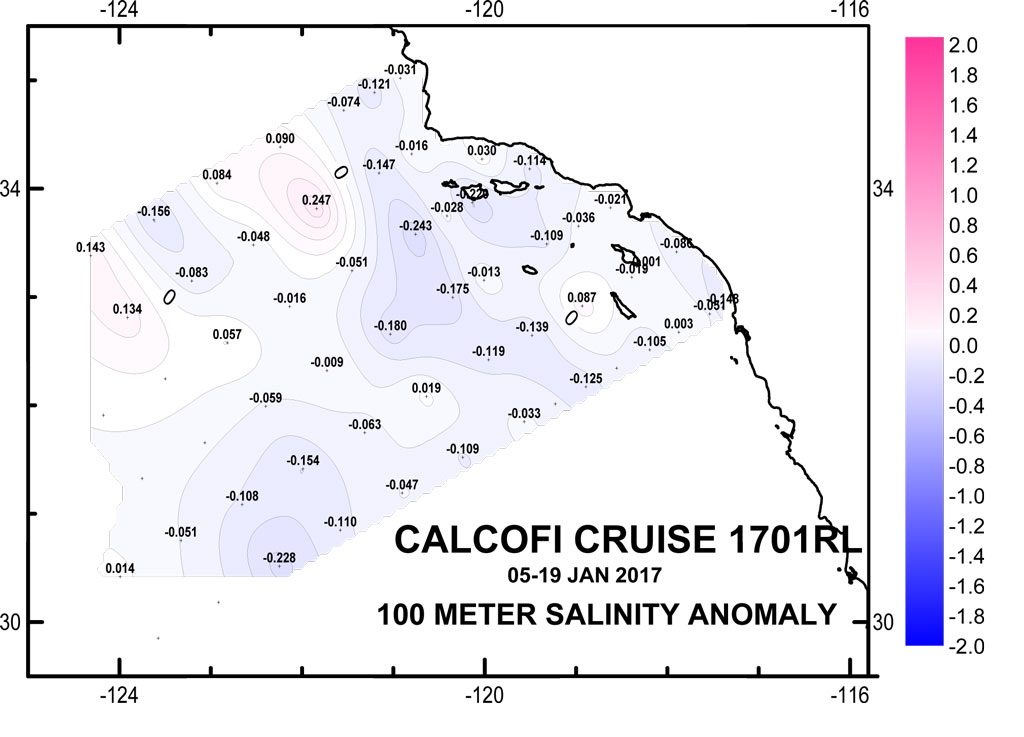
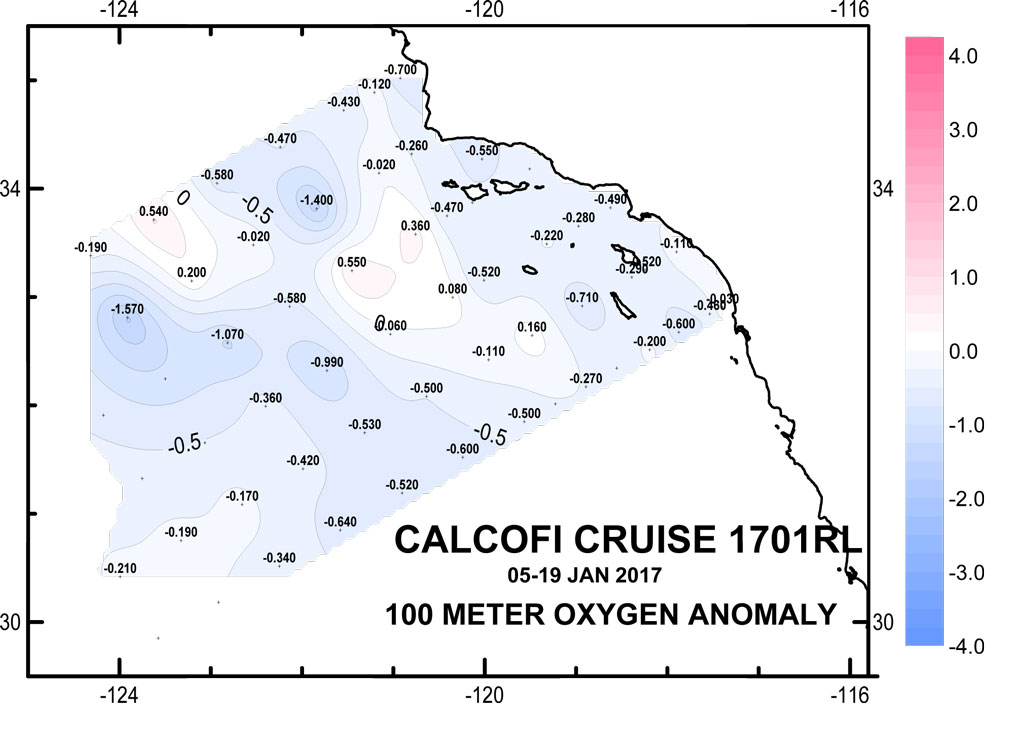
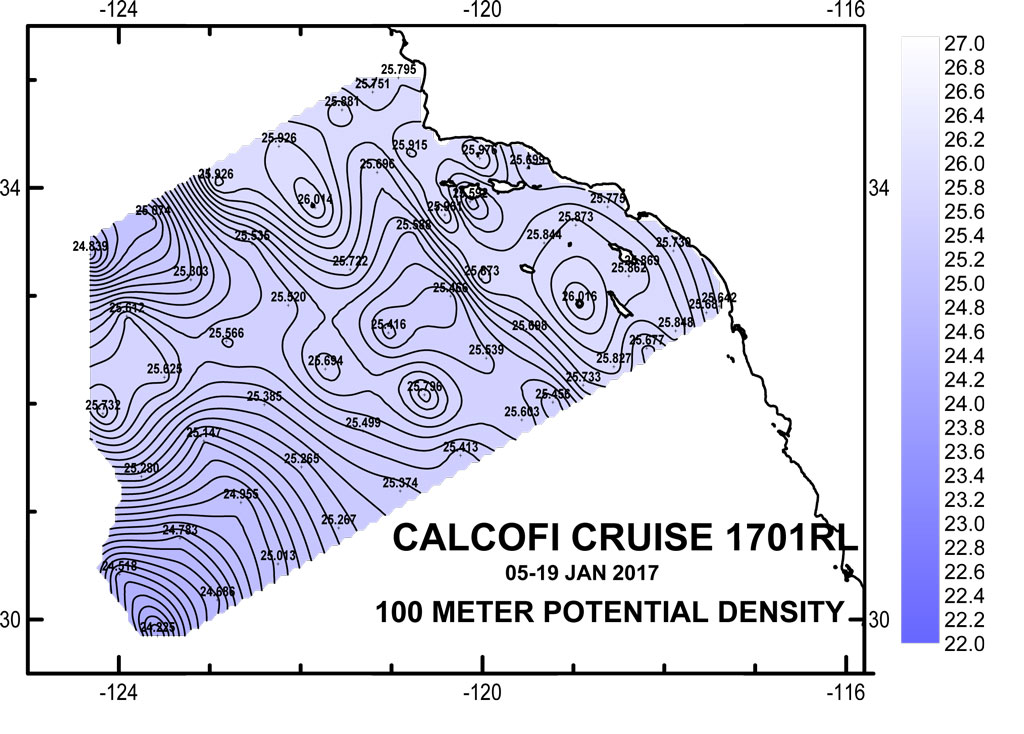
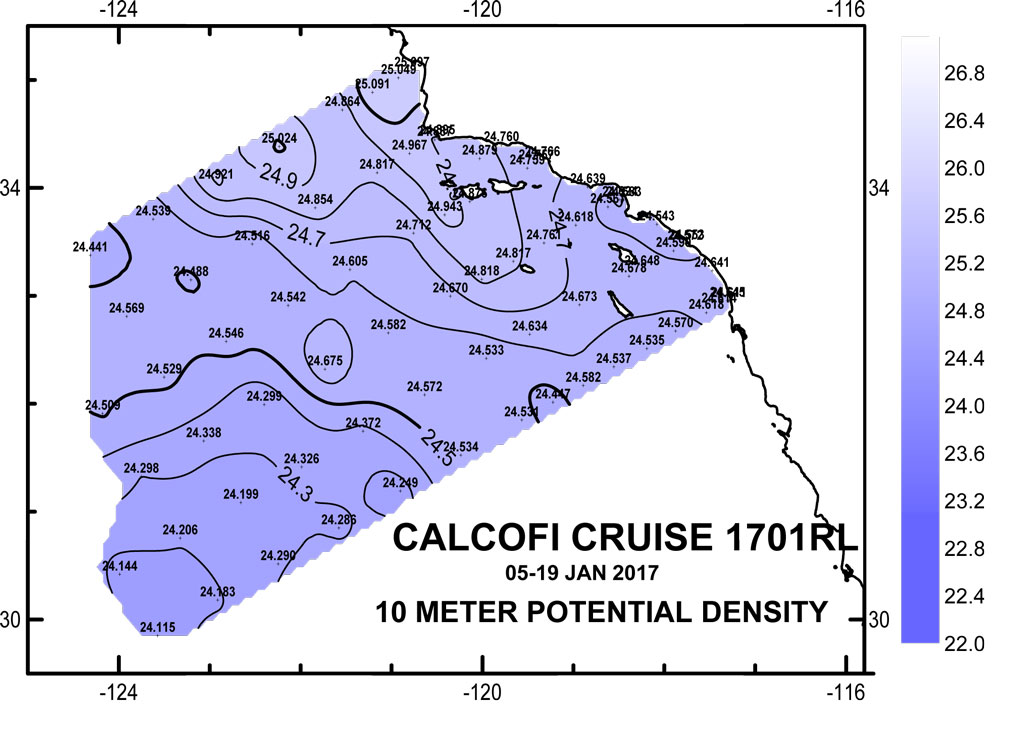
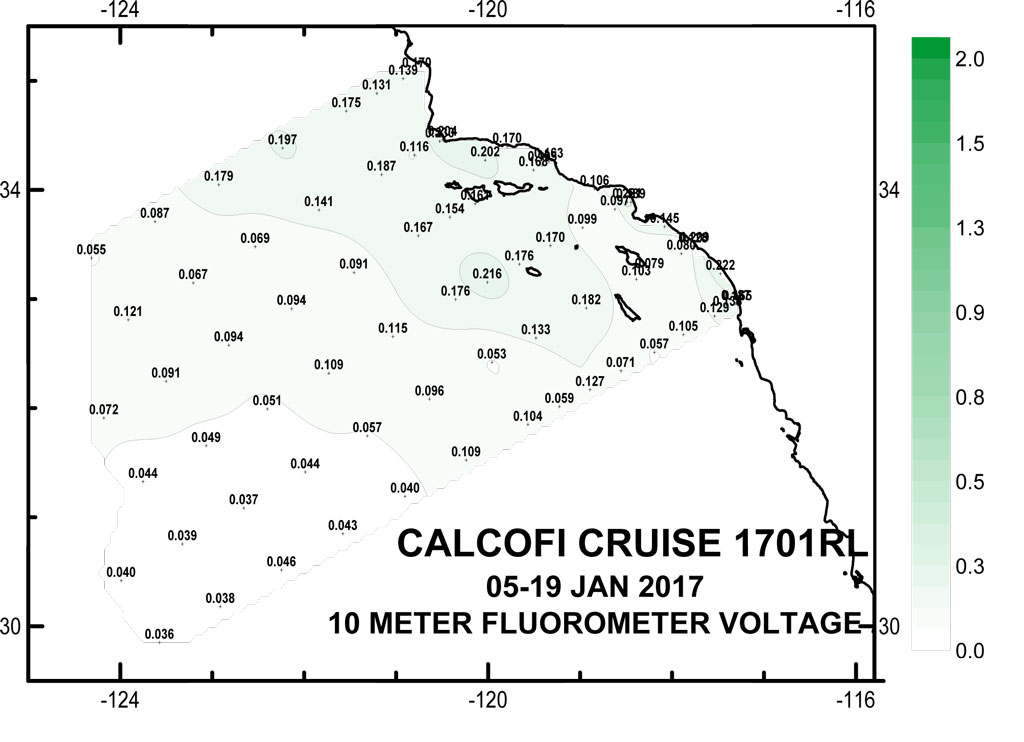
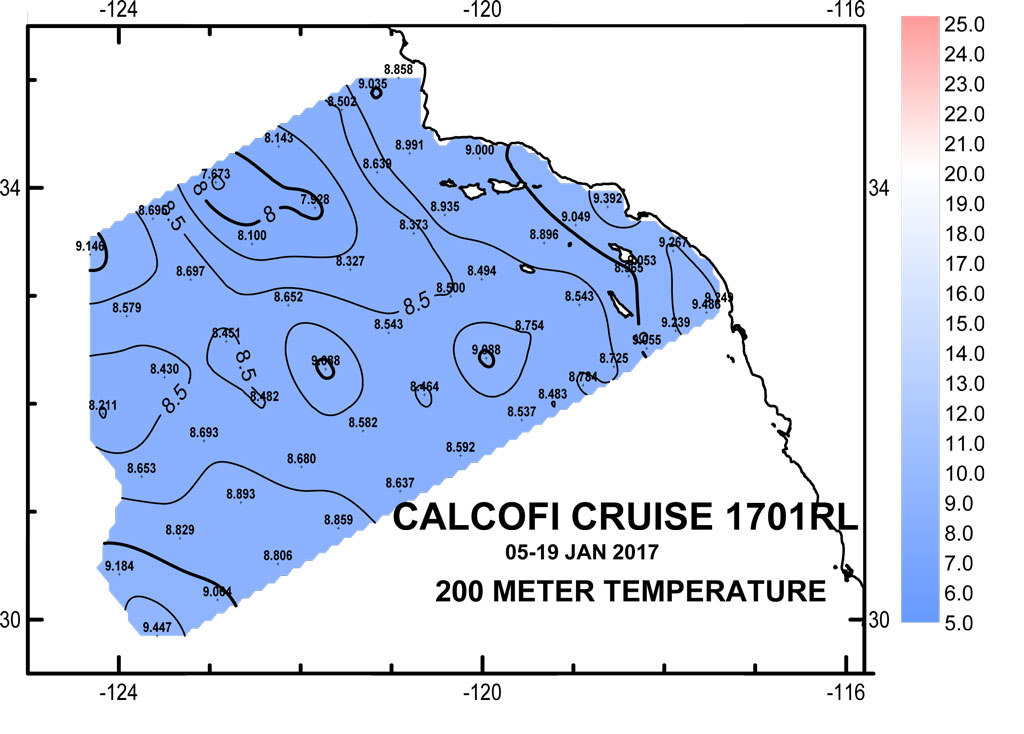
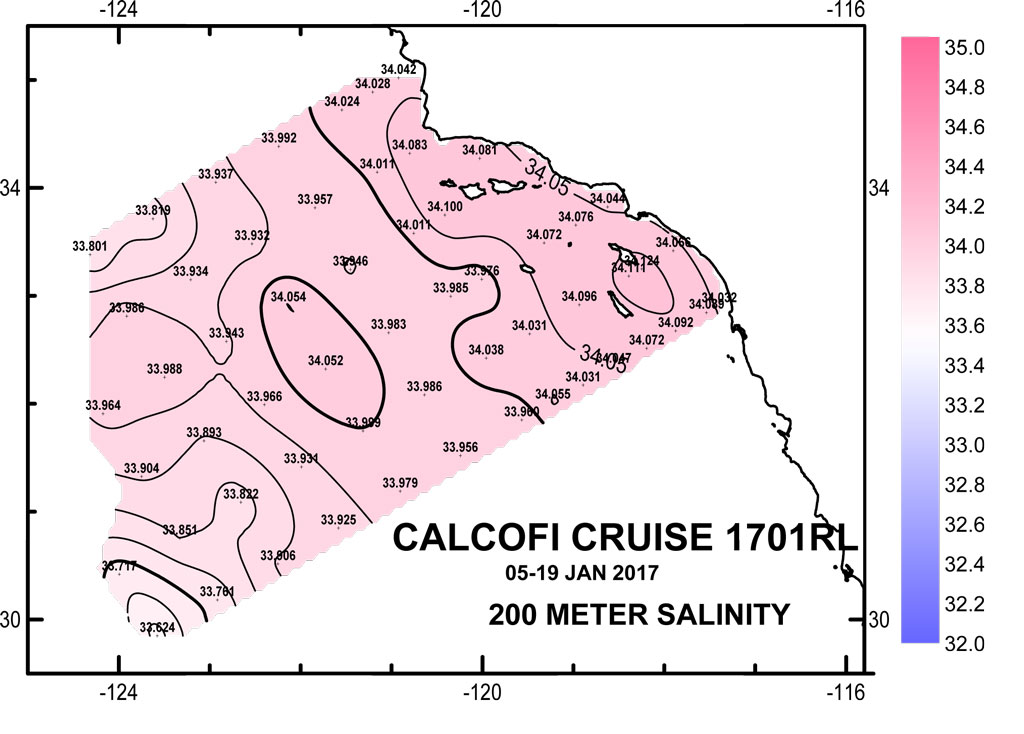
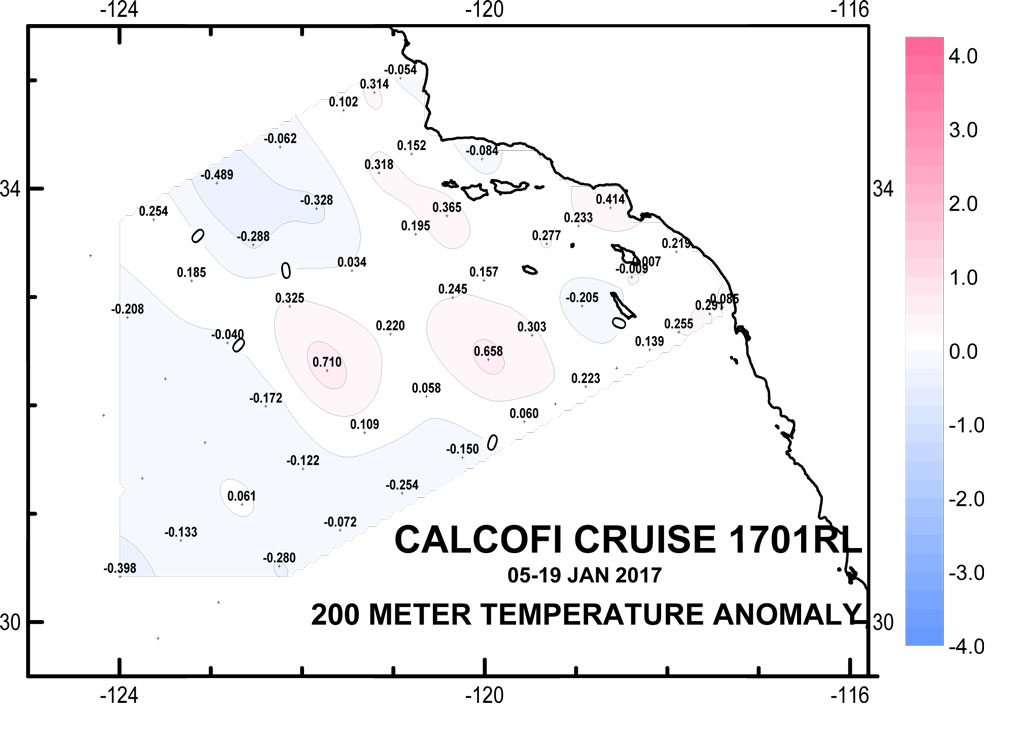
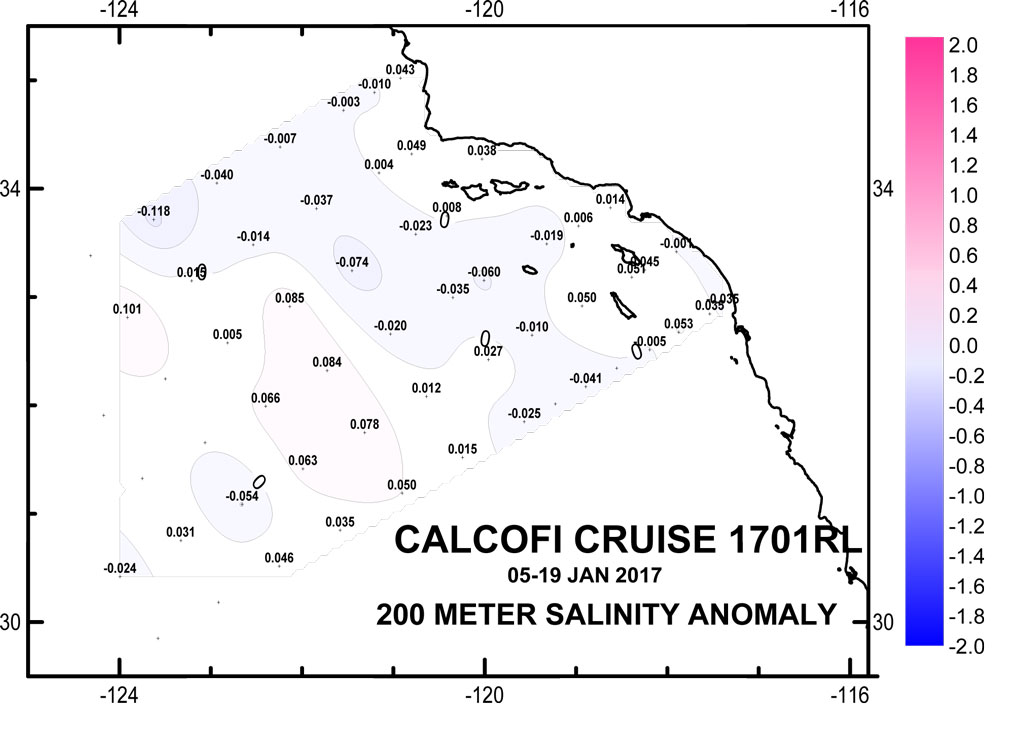
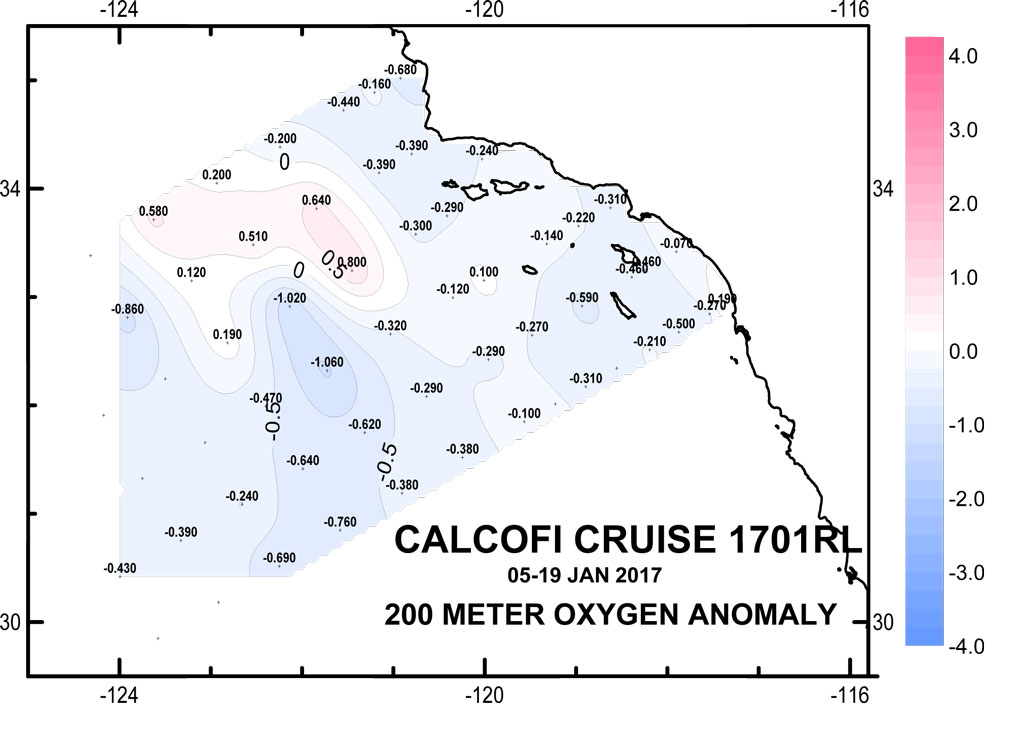
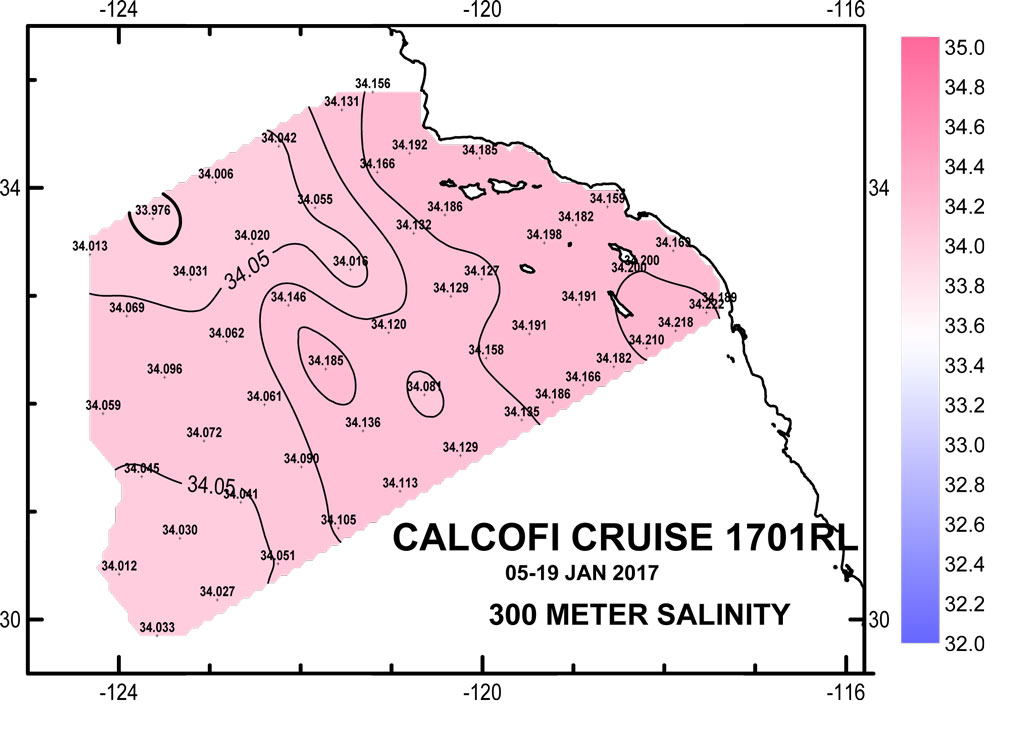
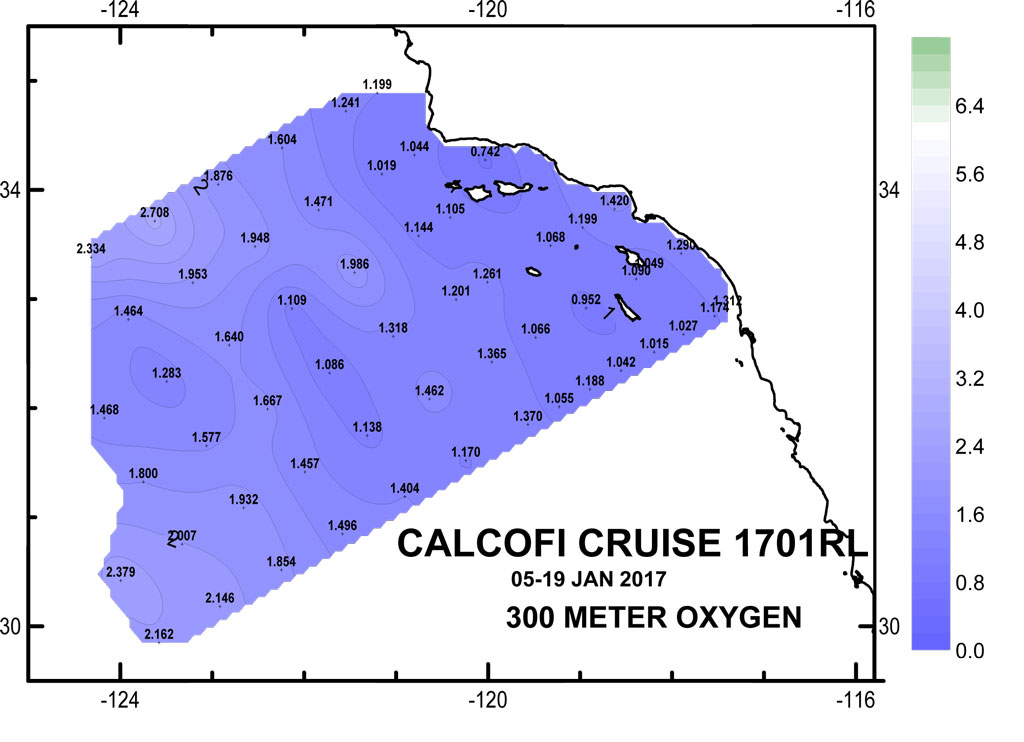
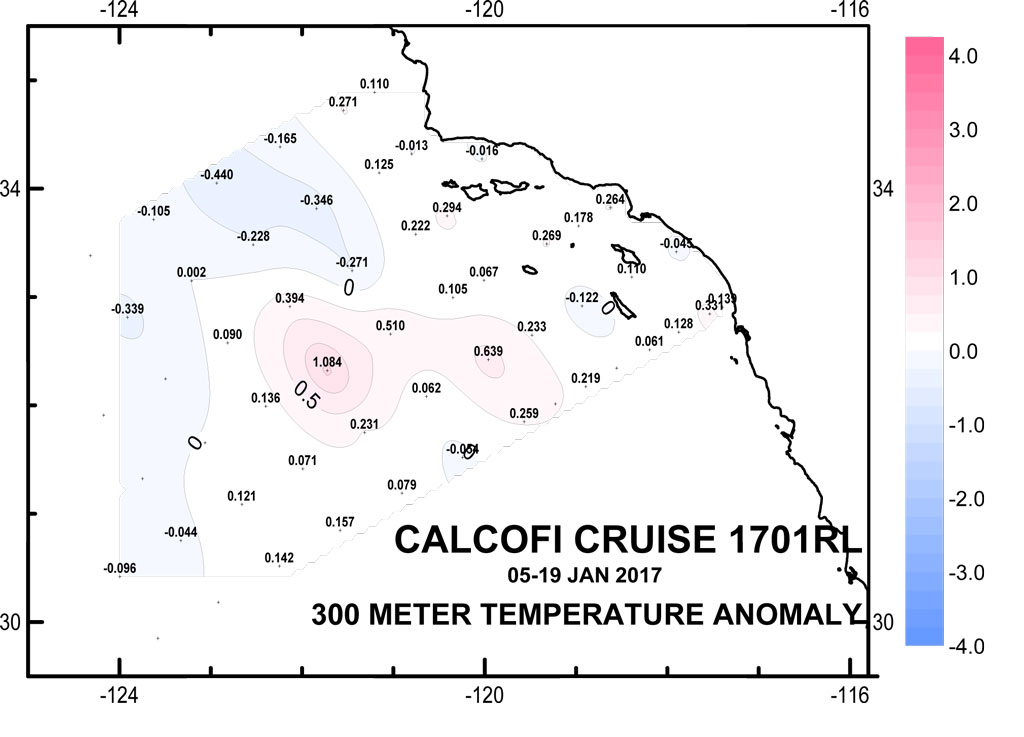
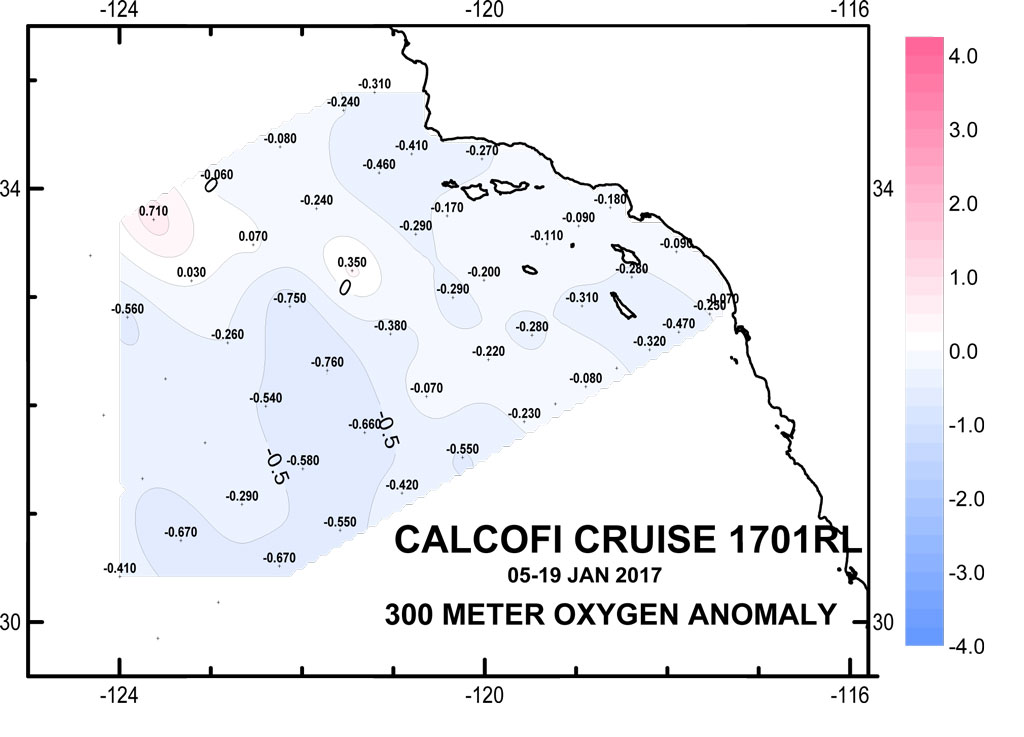
Please note that the anomalies are based on 50-year harmonics (1949-1999) and these data are 1m binavg Seasoft-processed CTD data that have not gone through thorough quality control checks or bottle corrections. They are presented to give a general impression of current conditions. Final data plots will be published after all data are processed.
| 10 & 100 meter Preliminary CTD Data & Anomaly (50yr mean) Contours (Click for larger image) | ||
 |
 |
 |
 |
 |
 |
 |
 |
 |
 |
 |
 |
 |
 |
 |
| 200 meters (Click for larger image) | ||
 |
 |
 |
 |
 |
 |
| 300 meter (Click for larger image) | ||
 |
 |
 |
 |
 |
 |